
SensorSync
Technical descriptions
The descriptions and static frames below explain the illustrated arrangements, including alternative views and selectable scenarios. Screenshots show the website examples; their accompanying text identifies what each example represents.
In these operational descriptions, visual observations mean information derived by applying machine learning to visual information: images, video frames, depth images, point clouds or inspection imagery. Models can detect and segment people and objects, estimate pose and placement, track movement, recognise actions, retrieve appearance candidates and identify anomalies. Sensor fusion associates selected visual outputs with other sensor measurements and operational records. Decorative drawings and website simulations remain illustrations rather than model outputs. Sensor-fusion methods and technology catalogue.
Shared operational environment
A spatial scene introduces connected movement, timing and equipment activity.
View the product example · Permanent figure link
The rendered environment presents schematic physical space, movement and equipment together. It supports the product explanation that machine learning applied to visual information, fused with other sensor measurements and operational records, can contribute to a shared picture of activity.
The digital environment connects movement and equipment activity. The sensor-fusion description explains the connected operational picture.
Capture movement, interactions and usage
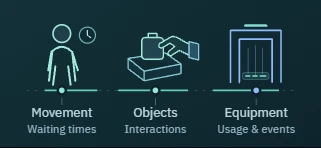
A common timeline connects movement, objects and equipment activity.
View the product example · Permanent figure link
Three visual groups show a person and clock, a hand interacting with a bag and tray, and equipment with activity indicators. Their placement along a shared timeline represents movement, waiting times, interactions and usage events as distinct observations. In an operational arrangement, machine learning derives these visual features from suitable images or video, and sensor fusion associates them with selected spatial, identifier and equipment inputs.
Combining these observations allows a journey or operation to be examined at the level of the contributing activities. The diagram describes categories of evidence; it does not claim that every source alone provides all categories.
Break a process into contributing activities
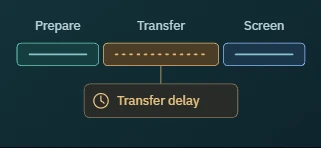
Preparation, transfer and screening are distinguished to expose a transfer delay.
View the product example · Permanent figure link
The process is divided into preparation, transfer and screening. A highlighted transfer segment and a connected delay annotation show how a delay in one activity can be isolated rather than treating the entire journey as a single unexplained duration.
The drawing separates the process into activities so the transfer delay can be examined in context.
Compare a response before the team acts
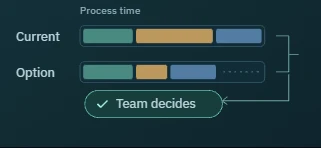
A current process and an alternative are shown with different activity durations.
View the product example · Permanent figure link
Two stacked process bars retain the same categories while changing one stage of the proposed option. Their difference represents a possible reduction in total process time. The flow ends at a team-decision marker.
The comparison shows the expected effect of a possible intervention before the team chooses its response.
Sensor fusion in a shared digital twin
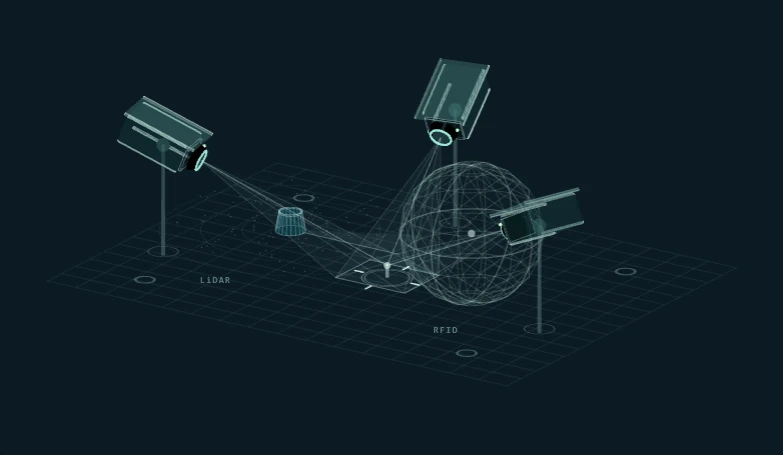
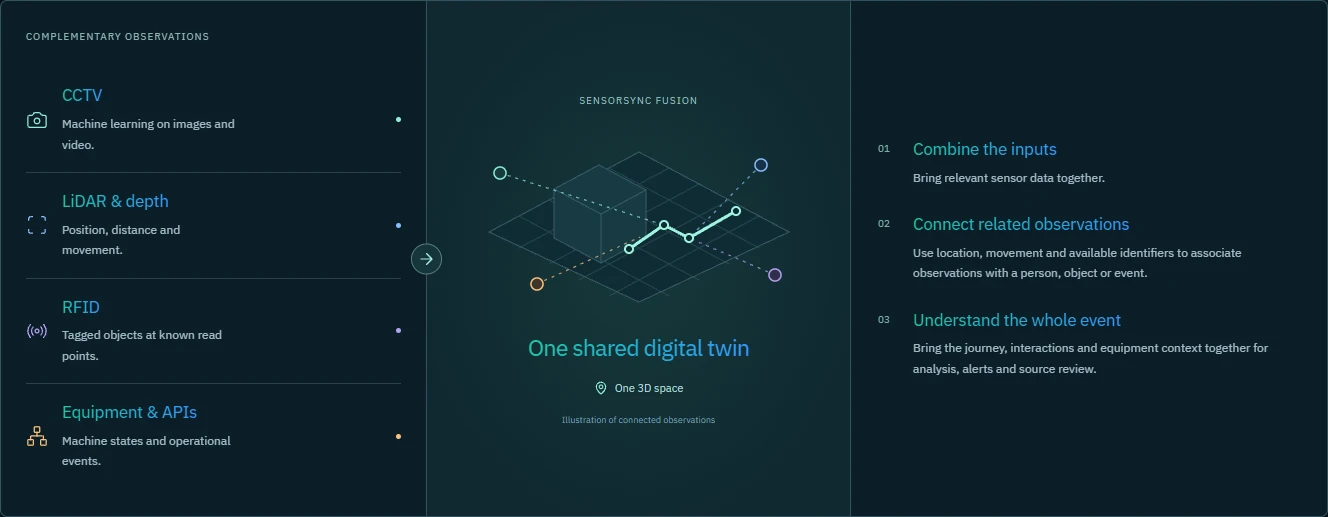
Machine learning applied to visual information is combined with LiDAR, RFID, screening and equipment data through sensor fusion.
View the product example · Permanent figure link
Machine learning applied to CCTV images and video derives detections, segmented objects, tracks, placement, interactions, actions and appearance candidates. Suitable depth images, point clouds and inspection images can also be analysed with modality-specific models. LiDAR or depth sensing supplies spatial measurements; RFID supplies supported tag identifiers; screening equipment and operational interfaces supply scan, alarm, completion and machine-state records.
Sensor fusion brings relevant observations together to support a connected operational picture.
In the lane arrangement, visual machine learning analyses tray loading and subsequent interactions. Spatial sensing contributes position, an RFID read can supply a tray identifier, and screening or lane equipment contributes operating status and task evidence. The combined record supports source-video and image review, including a flipbook of recorded tray interactions. The technology catalogue below describes further possible inputs and screening modalities; sources and supported associations are selected for the installation.
Security lane activity
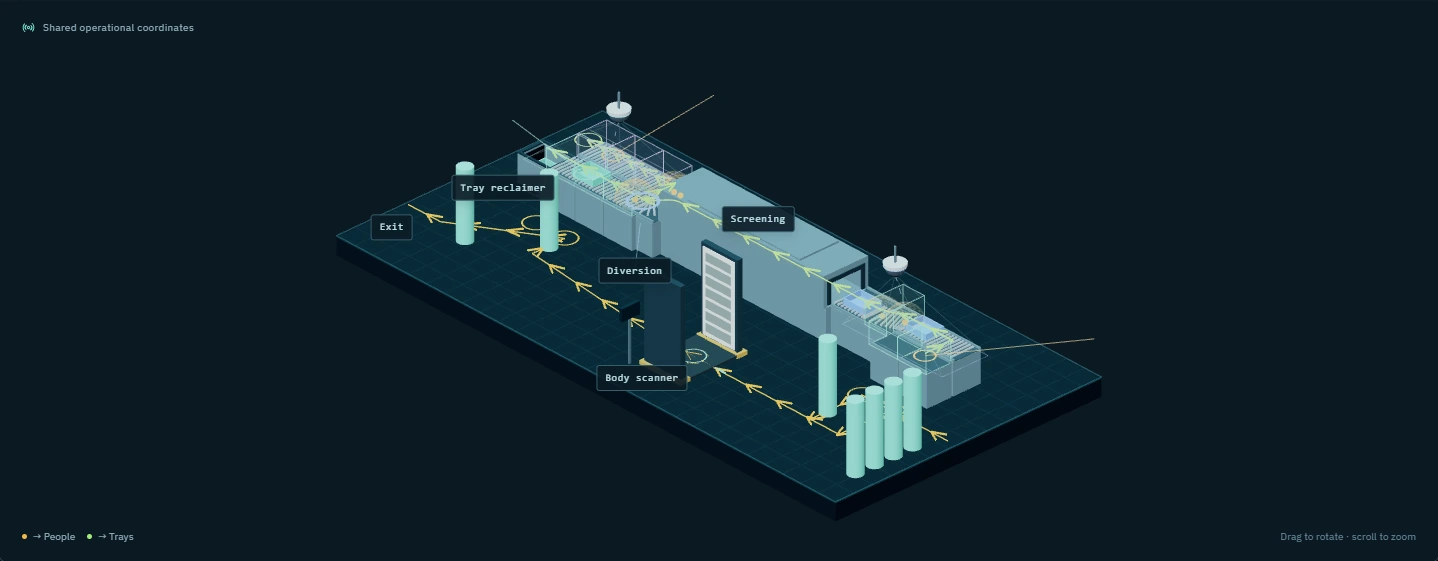
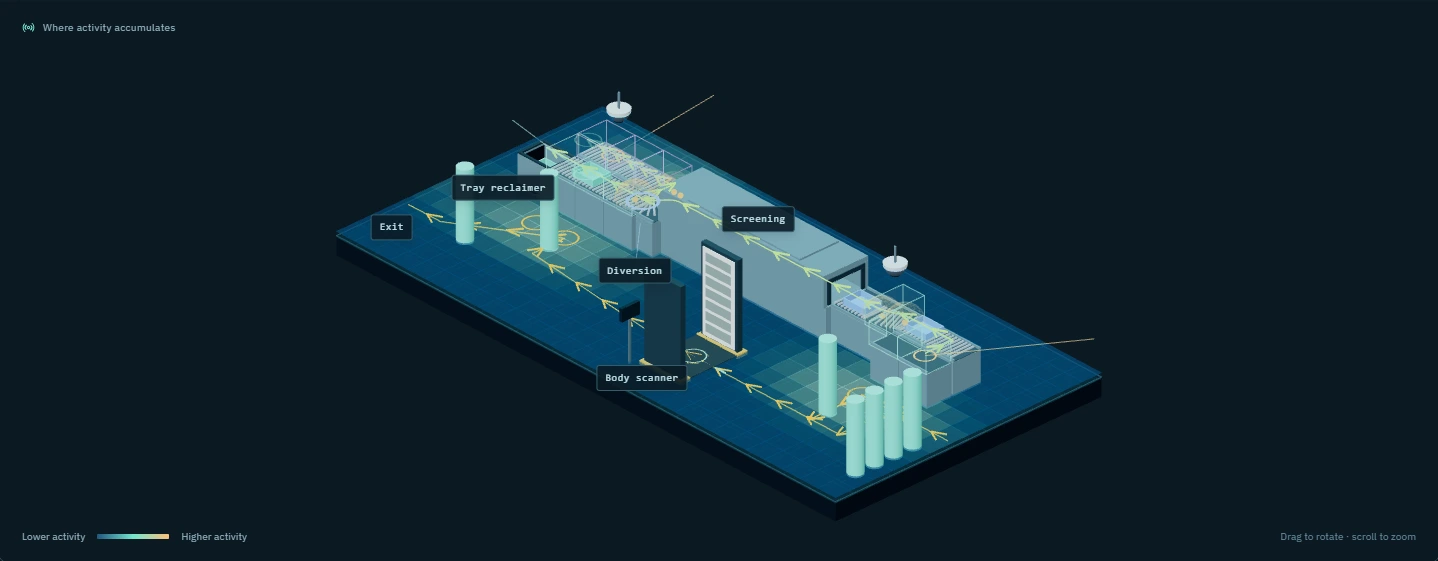
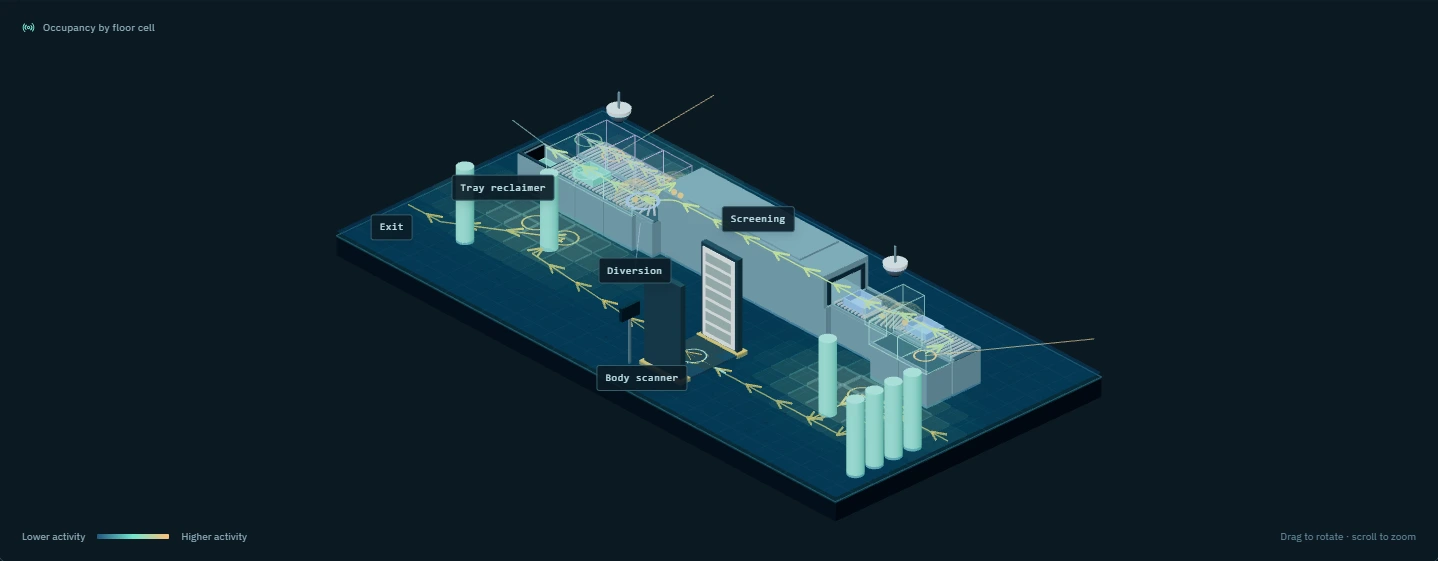
People and trays move through a lane while activity is compared with usual conditions.
View the product example · Permanent figure link
The lane example distinguishes passenger and tray movement. Callouts compare rejected trays, passenger reclaim time, divest time and trays per passenger with the scenario baseline. Equipment and clearance states can hold the simulated movement before it resumes.
In the operational arrangement, machine learning applied to visual information derives people, object and interaction observations. Sensor fusion associates these with selected spatial sensors, identifiers and equipment records. The digital-twin view shows spatial objects and paths. The heatmap view shows where activity accumulates. The occupancy view divides the space into floor cells to show relative use. Camera rotation and an overhead view change presentation without changing the underlying example. All three representations are included as stills here.
The scenarios connect activity, comparisons and event context in a shared operational view.
Checkpoint preparation and capacity
Preparation and equipment availability are related to checkpoint queue pressure.
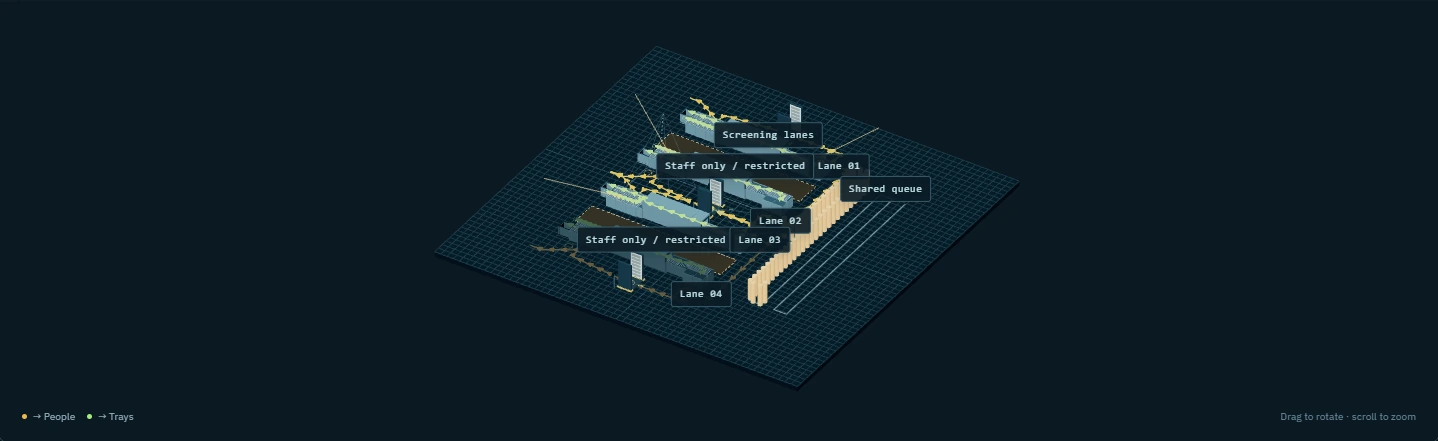
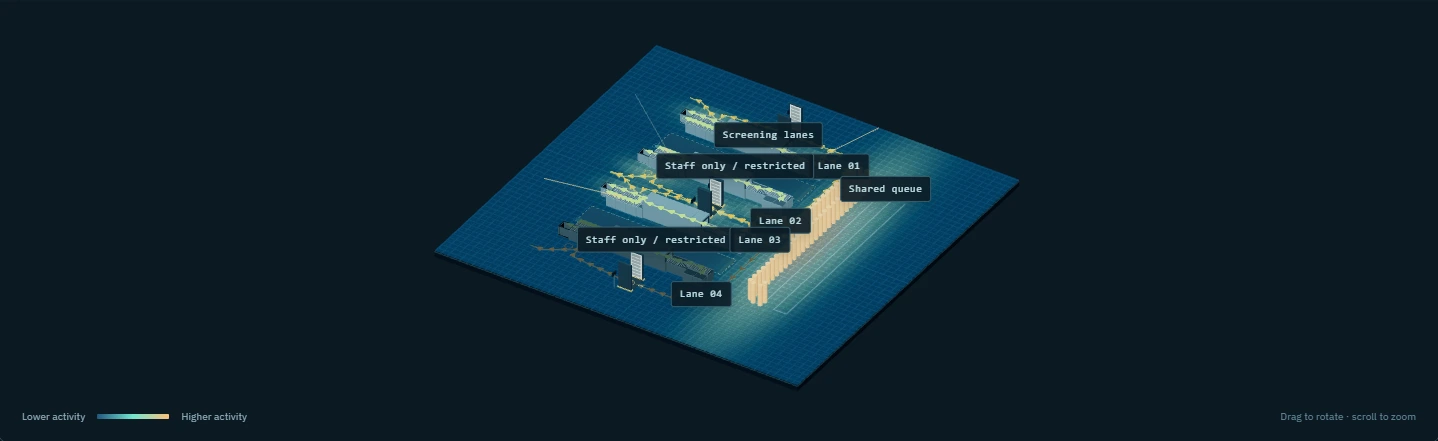
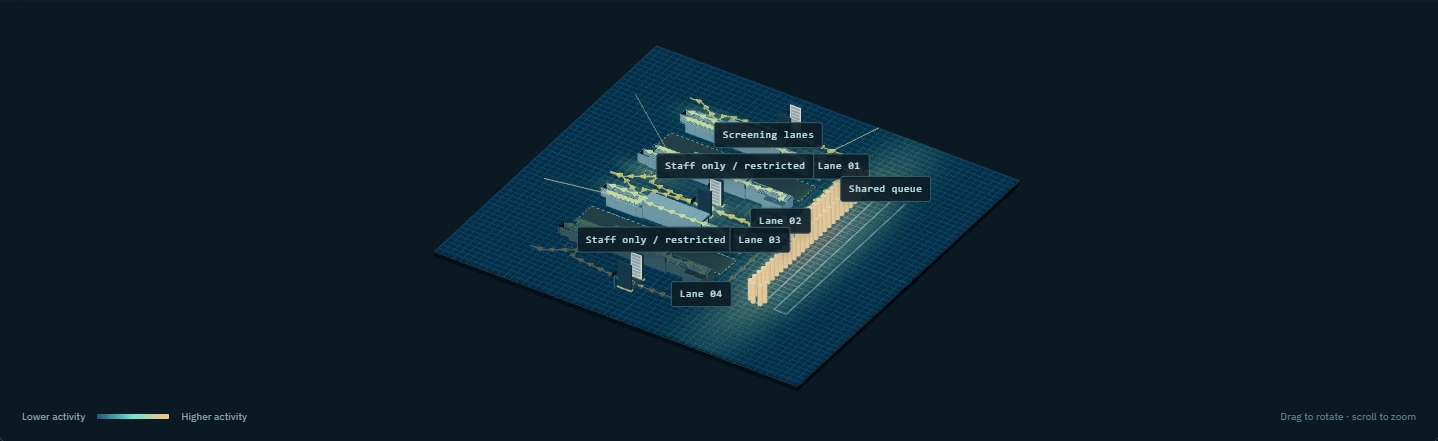
View the product example · Permanent figure link
The checkpoint example connects preparation areas, queues and screening lanes. Callouts distinguish the contribution of preparation time, tray demand and available processing capacity. Movement and occupancy expose where arrivals accumulate.
In the operational arrangement, machine learning applied to visual information derives people, object and interaction observations. Sensor fusion associates these with selected spatial sensors, identifiers and equipment records. The digital-twin view shows spatial objects and paths. The heatmap view shows where activity accumulates. The occupancy view divides the space into floor cells to show relative use. Camera rotation and an overhead view change presentation without changing the underlying example. All three representations are included as stills here.
The scenarios connect activity, comparisons and event context in a shared operational view.
Baggage reclaim activity
People, baggage and collection activity are viewed together at reclaim.
View the product example · Permanent figure link
The reclaim example places passenger movement and baggage activity in shared space. The animation and readouts illustrate accumulation, collection and a safety-related interruption. These observations support review of which part of the reclaim process needs attention.
In the operational arrangement, machine learning applied to visual information derives people, object and interaction observations. Sensor fusion associates these with selected spatial sensors, identifiers and equipment records. The digital-twin view shows spatial objects and paths. The heatmap view shows where activity accumulates. The occupancy view divides the space into floor cells to show relative use. Camera rotation and an overhead view change presentation without changing the underlying example. All three representations are included as stills here.
The scenarios connect activity, comparisons and event context in a shared operational view.



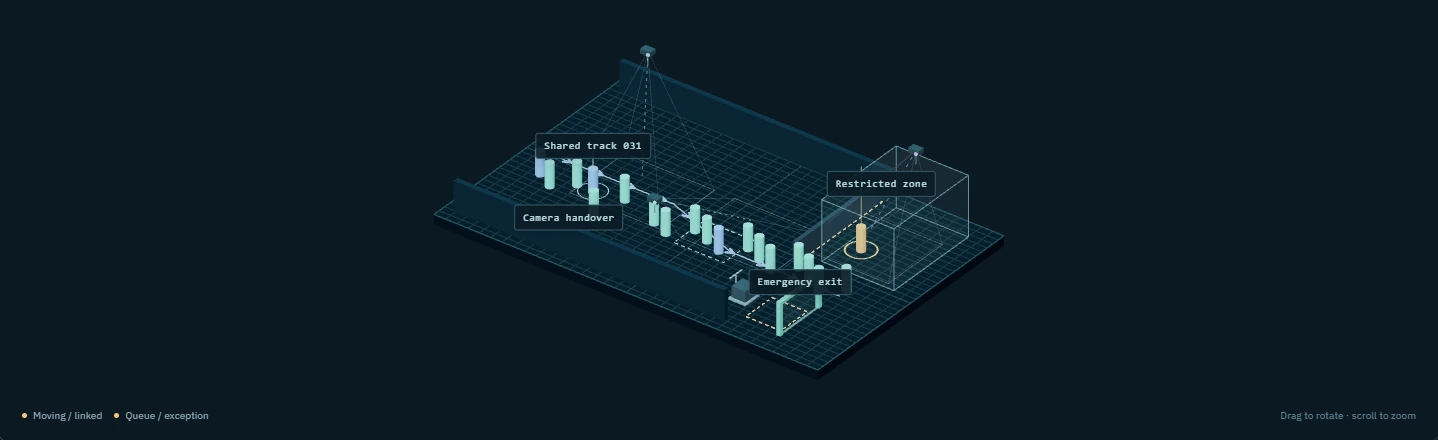
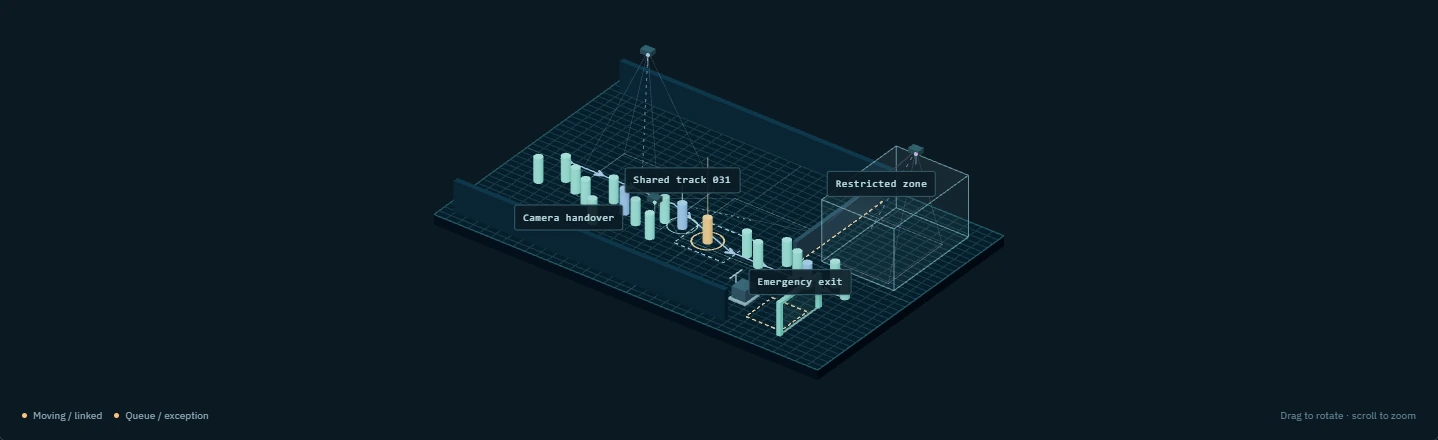
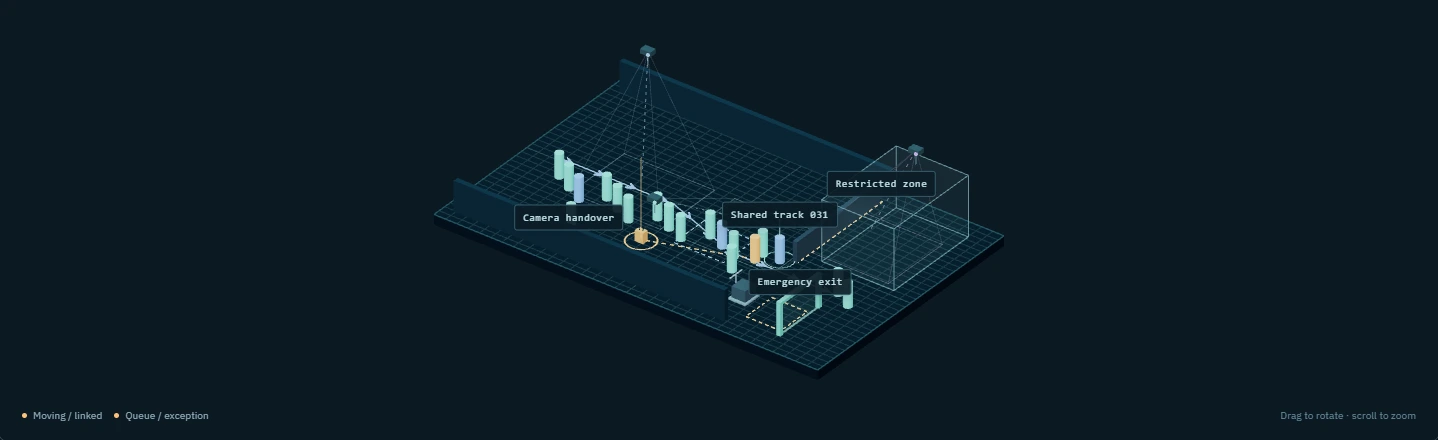
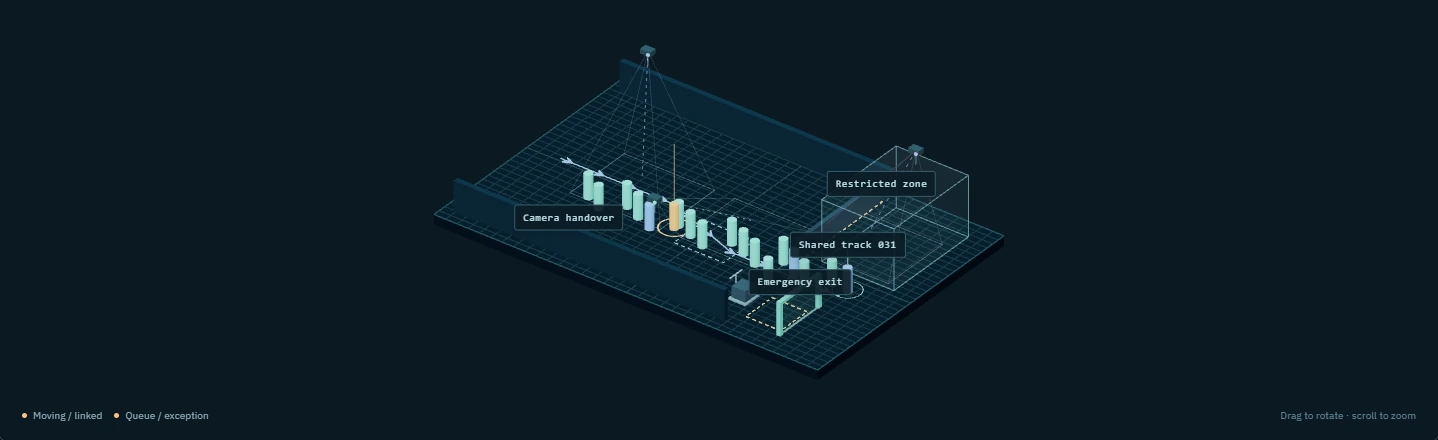
Security event review
Configured incidents are related to their location, status and source context.
View the product example · Permanent figure link
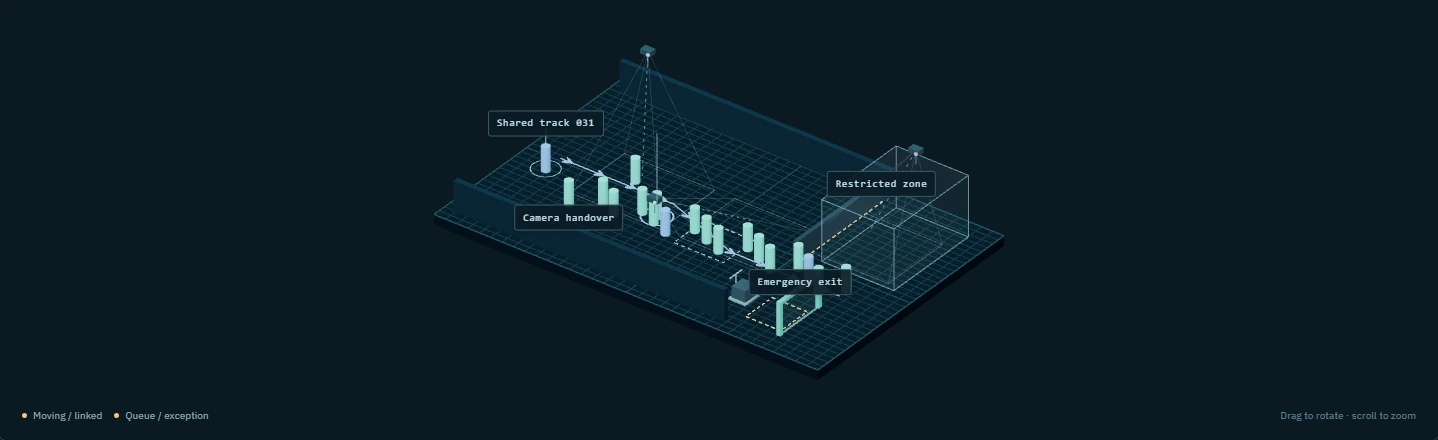
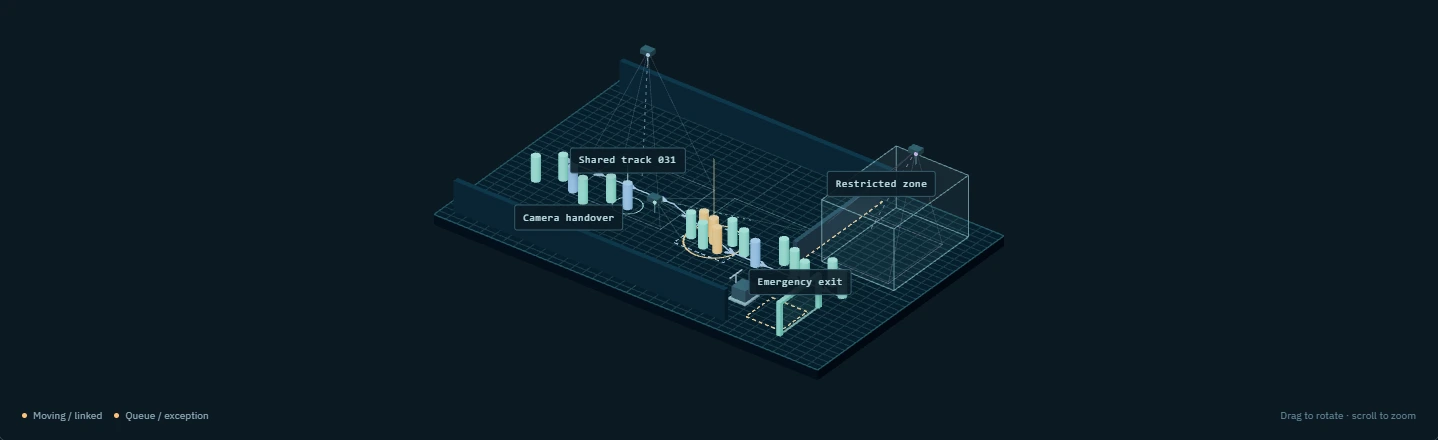
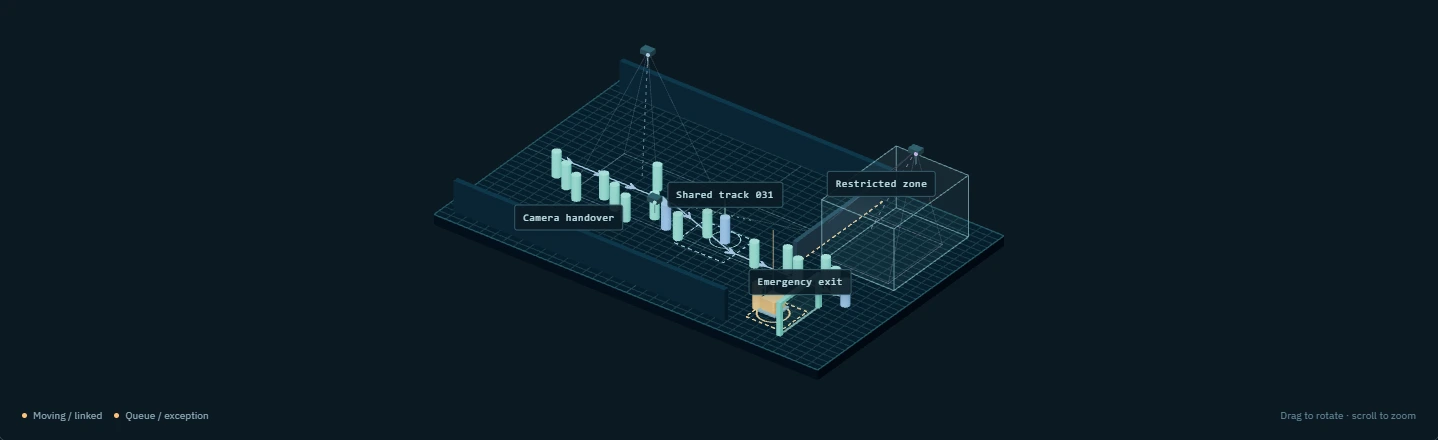
The security example selects six authored events: restricted-zone entry, prolonged dwell, an unattended bag, wrong-way movement, crowding and an obstructed emergency exit. Each event has a location, timing and review status, so the spatial alert is connected with an explanation for staff.
In the operational arrangement, machine learning applied to visual information derives people, object and interaction observations. Sensor fusion associates these with selected spatial sensors, identifiers and equipment records. The digital-twin view shows spatial objects and paths. The heatmap view shows where activity accumulates. The occupancy view divides the space into floor cells to show relative use. Camera rotation and an overhead view change presentation without changing the underlying example. All three representations are included as stills here.
The scenarios connect activity, comparisons and event context in a shared operational view.


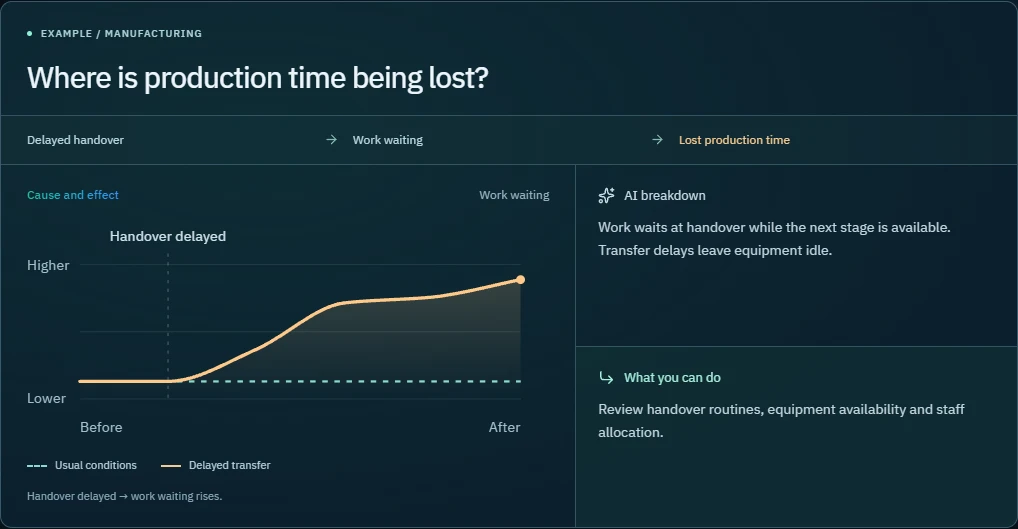
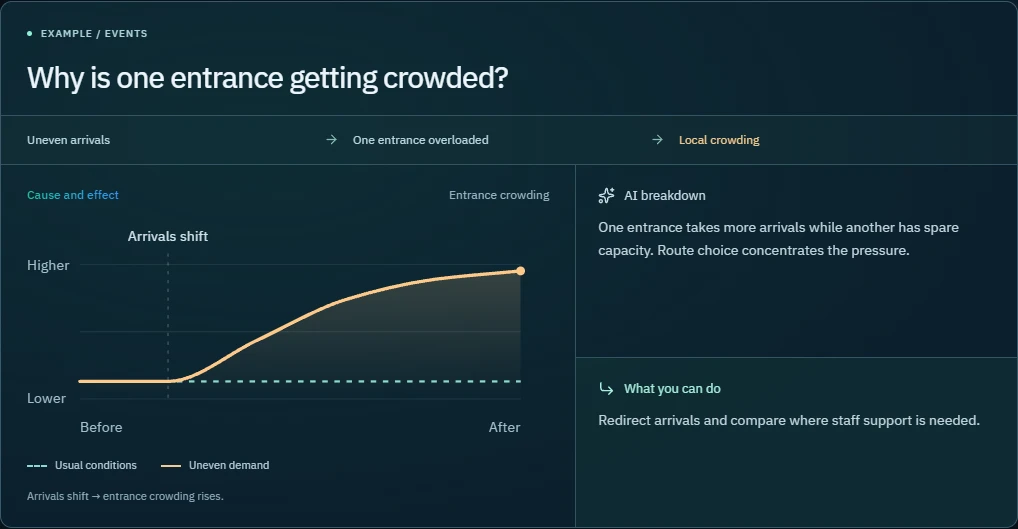
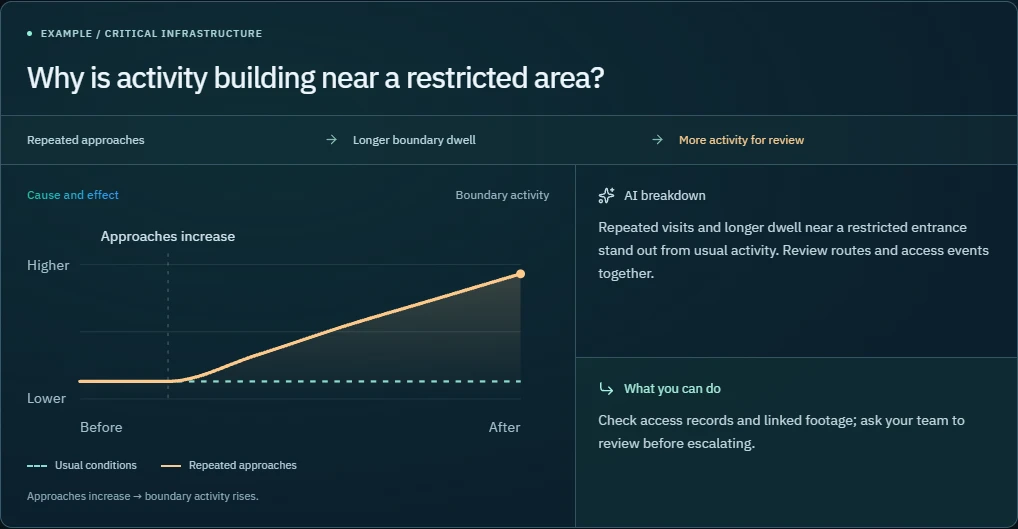
Explain why activity changes
Five conceptual examples connect an operational change to a cause, consequence and possible response.
View the product example · Permanent figure link
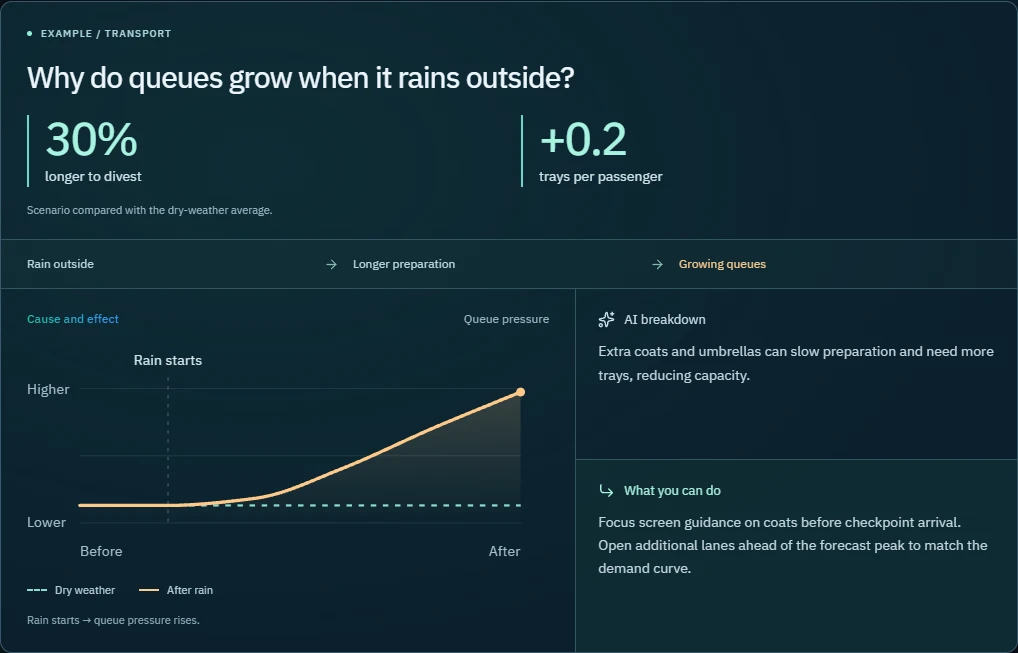
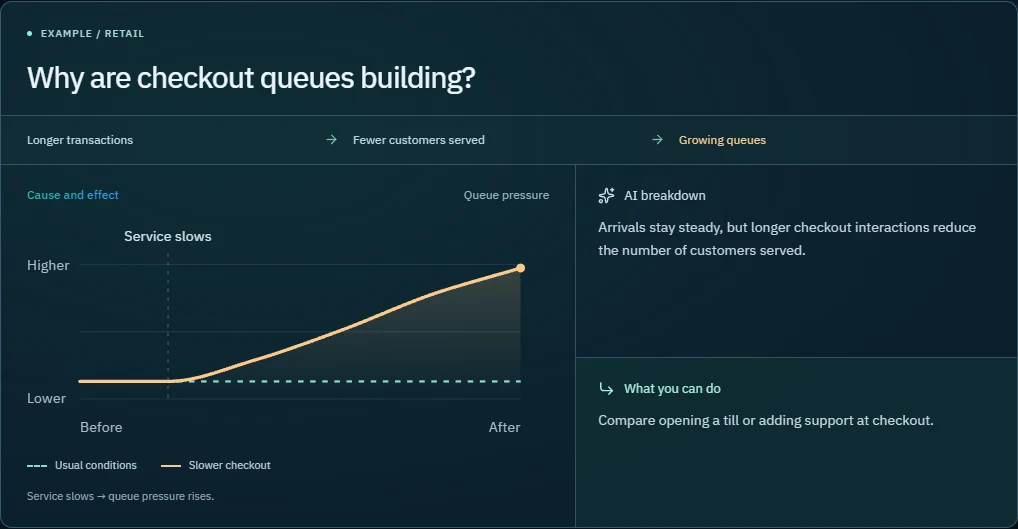
Transport: rain increases preparation work through coats, umbrellas and tray demand, contributing to queues. Retail: longer checkout interactions reduce service capacity while arrivals remain steady. Manufacturing: delayed handovers leave work waiting even when downstream equipment is available.
Events: uneven arrivals overload one entrance while another has capacity. Critical infrastructure: repeated approaches and longer dwell near a restricted entrance provide a reason to review routes, access events and footage.
Each selectable panel includes a cause chain, a before-and-after curve, an explanation and a proposed action. The transport panel compares a rain scenario with a dry-weather baseline.
Validate completion of required screening tasks
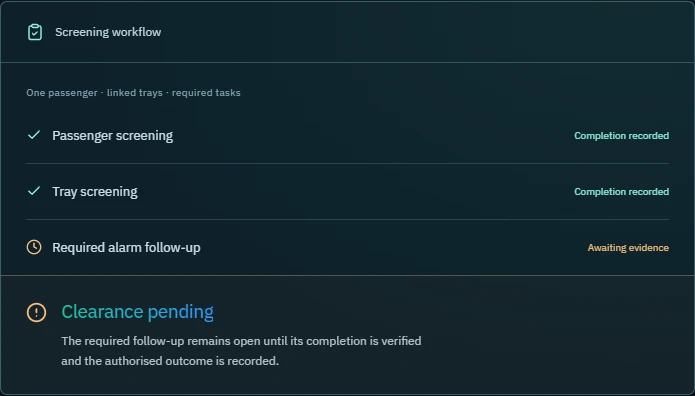
Required tasks stay open until appropriate completion evidence is associated with the subject.
View the product example · Permanent figure link
The arrangement defines screening and follow-up tasks under the site procedures and associates them with the relevant passenger, tray or item. Machine learning applied to visual information can identify candidate screening interactions. Sensor fusion links these outputs with selected spatial sensors, identifiers, connected screening results and staff records to the correct subject and task.
The illustrated record shows passenger screening and tray screening as completed while alarm follow-up lacks verified completion. Overall clearance remains pending. Missing, conflicting or unverified evidence is referred to authorised staff under the configured procedures.
Zero-trust describes checking the evidence for each required step rather than assuming completion from passage through the lane.
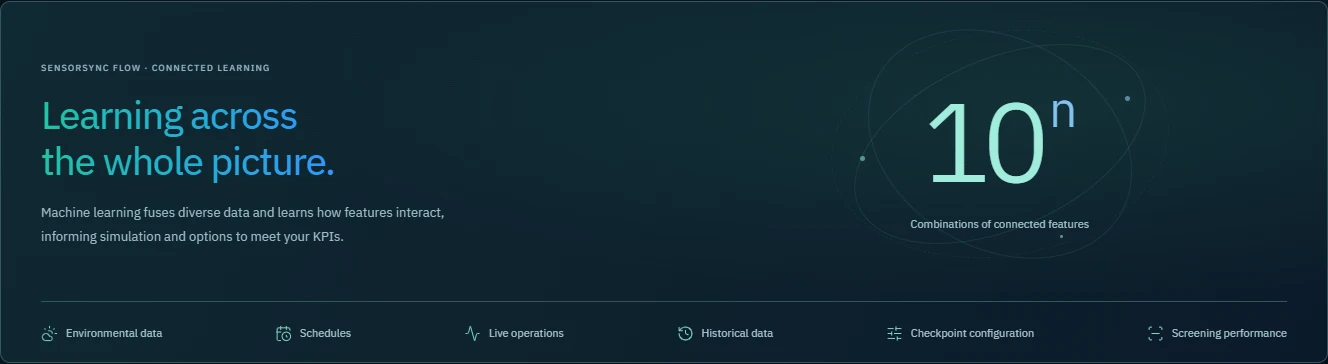
Learning across connected features
Machine learning combines diverse data and learns how features interact to inform simulation and KPI options.
View the product example · Permanent figure link
Connected data can include environmental information, schedules, live operations, historical records, checkpoint configuration and screening performance. Machine learning applied to visual information and sensor fusion can contribute features alongside these data sources.
The ten-to-the-power-of-n graphic represents a conceptual space of feature combinations. It does not specify a measured training-set size or fixed number of combinations. Selected data and models vary by deployment.
Flow and React operational overview
Connected observations support an understanding of demand, planning and authorised staff response.
View the product example · Permanent figure link
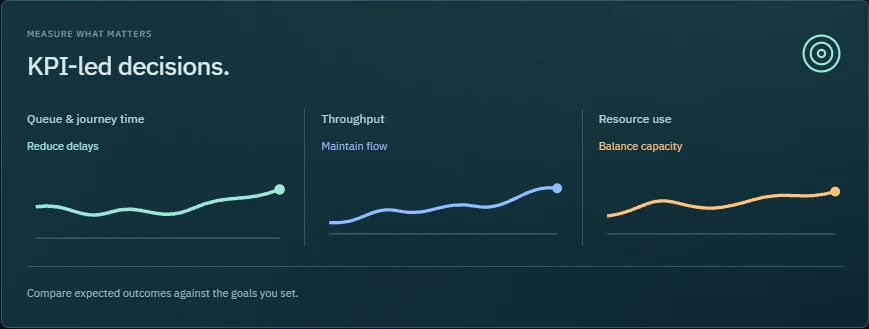
Machine learning applied to visual information and sensor fusion connect selected observations with lane availability and operational records. The overview relates operational measurements to queue and journey time, throughput and resource-use priorities.
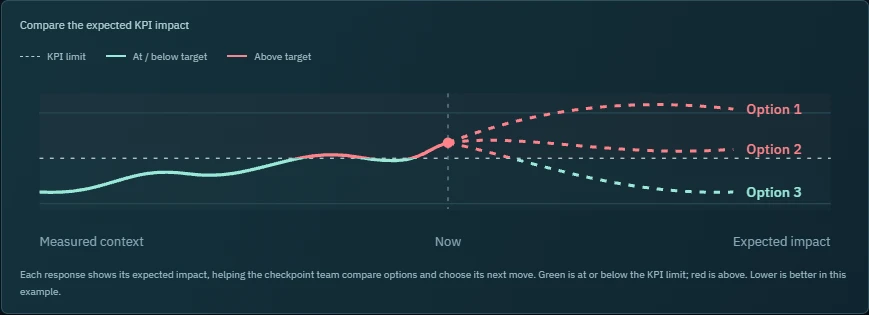
Operational measurements can inform simulation of changing demand, capacity and constraints. Digital-twin simulation can compare passenger load balancing across lanes as demand and capacity change. Operational superintelligence can propose responses against selected KPI priorities. React presents their expected impact so the checkpoint team can compare options and choose an authorised response. The graph labels three alternatives as Option 1, Option 2 and Option 3. Reviewing outcomes can inform subsequent planning.
A dashed KPI limit provides a common reference; curve sections below the line are green and sections above it are red. Lower values indicate better outcomes in this example.
Nodal connection and processing overview
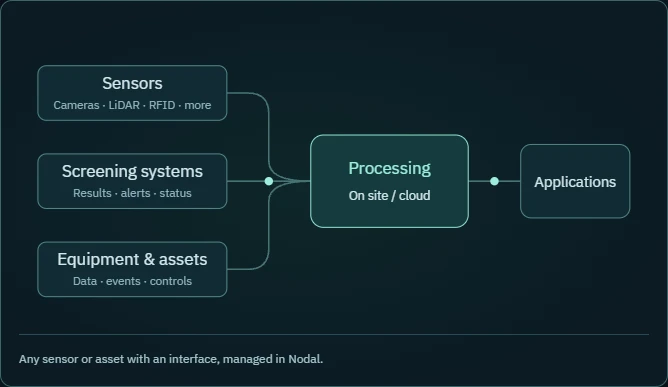
Any sensor or asset with an interface can connect to processing and applications, including equipment and screening systems.
View the product example · Permanent figure link
The map groups sensors, screening systems, equipment and other assets as source nodes. Cameras, LiDAR and RFID are examples rather than an exhaustive sensor list. Available interfaces may carry observations, screening results, alerts, equipment states, asset events or control commands. Integration is configured for the connected source and deployment.
Machine learning applied to visual information derives visual features and events; sensor fusion associates them with other sensor measurements and operational records. Sources connect to processing that can be located on site or in the cloud, followed by operational applications. Nodal provides a place to understand these connections and processing locations.
Connection health, maintenance and support access are considered alongside the topology so staff can investigate a missing feed. The schematic is a static connection diagram, not a live network-monitoring screen.
Passenger–tray association and interaction review
Tray ownership combines association records with video and images of people interacting with the tray.
View the product example · Permanent figure link
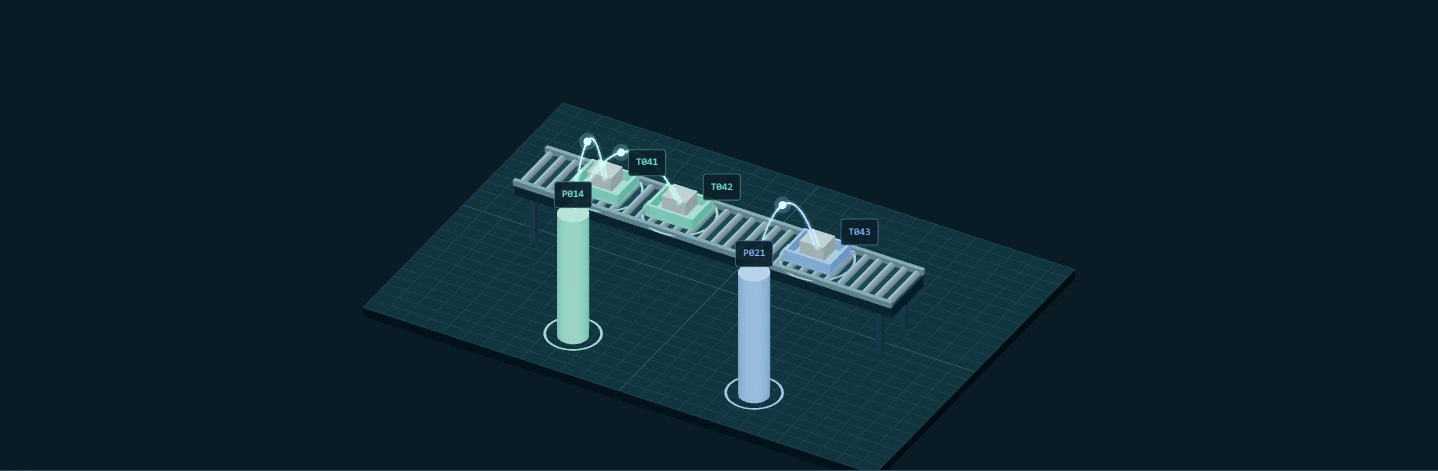
Machine learning applied to images and video detects and tracks people, trays and their interactions from preparation to collection. Sensor fusion associates these visual outputs with supported RFID tray identifiers, LiDAR or depth measurements and lane or screening records. One passenger may be associated with several trays; travelling-group relationships add context for companion collection.
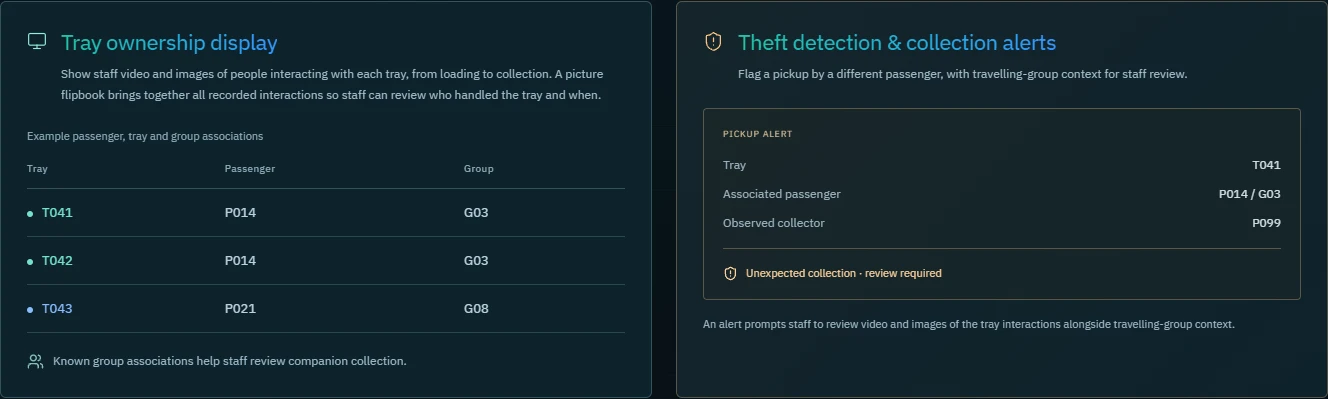
Staff can review video and images of people interacting with each tray. A picture flipbook brings together all recorded interactions so staff can examine who handled a tray and when. The media records provide interaction context alongside the passenger, tray and group associations.
The illustrated twin links T041 and T042 to P014 and T043 to P021 using matching colours. The table shows those associations and groups. A separate authored alert shows P099 collecting T041, associated with P014 in G03, prompting review of the interaction media and group context. These figures illustrate associations and an alert; they are not an example camera-video flipbook or evidence of a real theft.
AI-controlled, optimised lane control
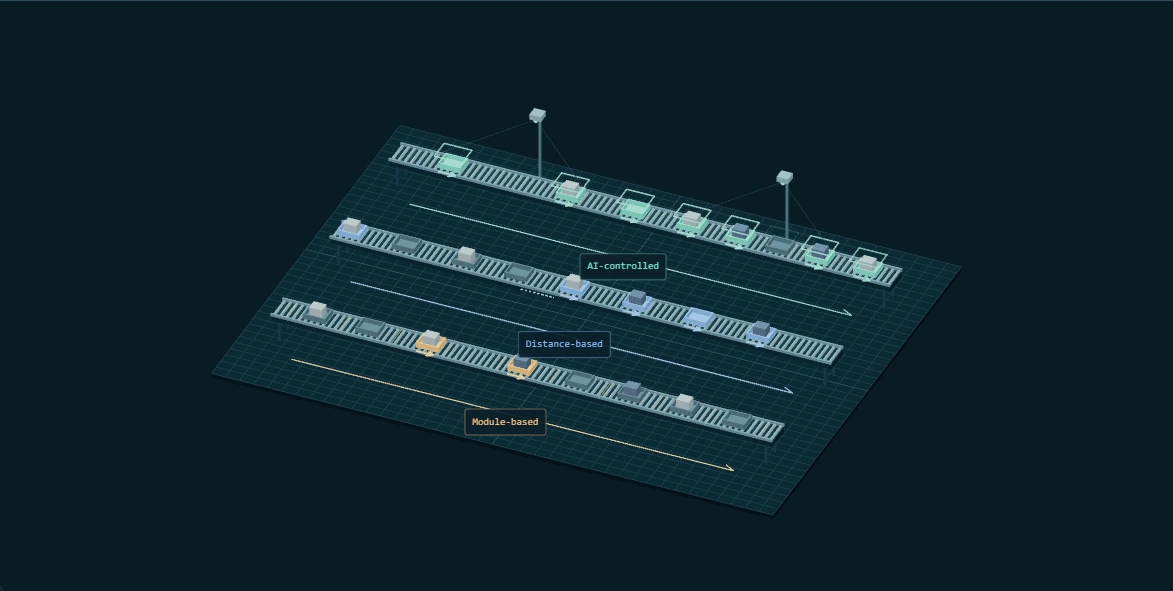
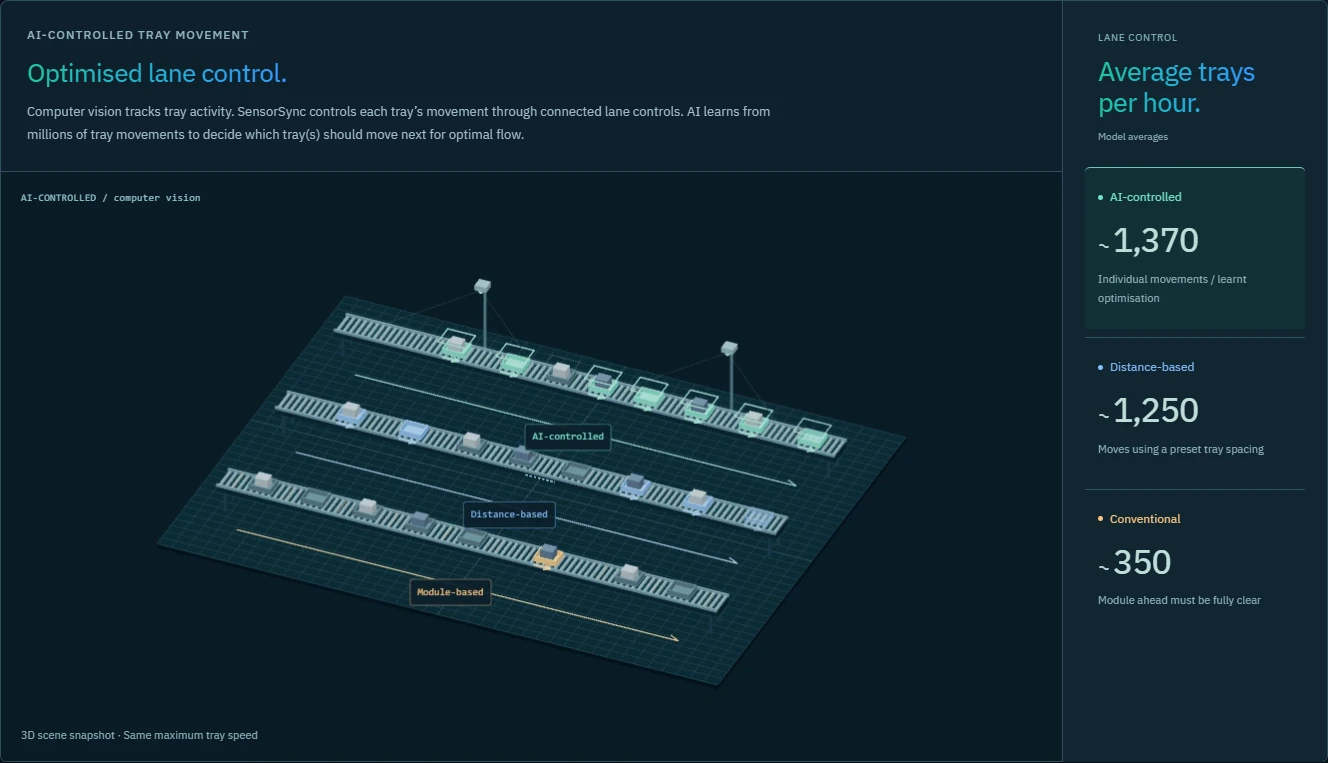
SensorSync controls individual tray movements through connected lane controls, using computer vision and learned optimisation for optimal flow.
View the product example · Permanent figure link
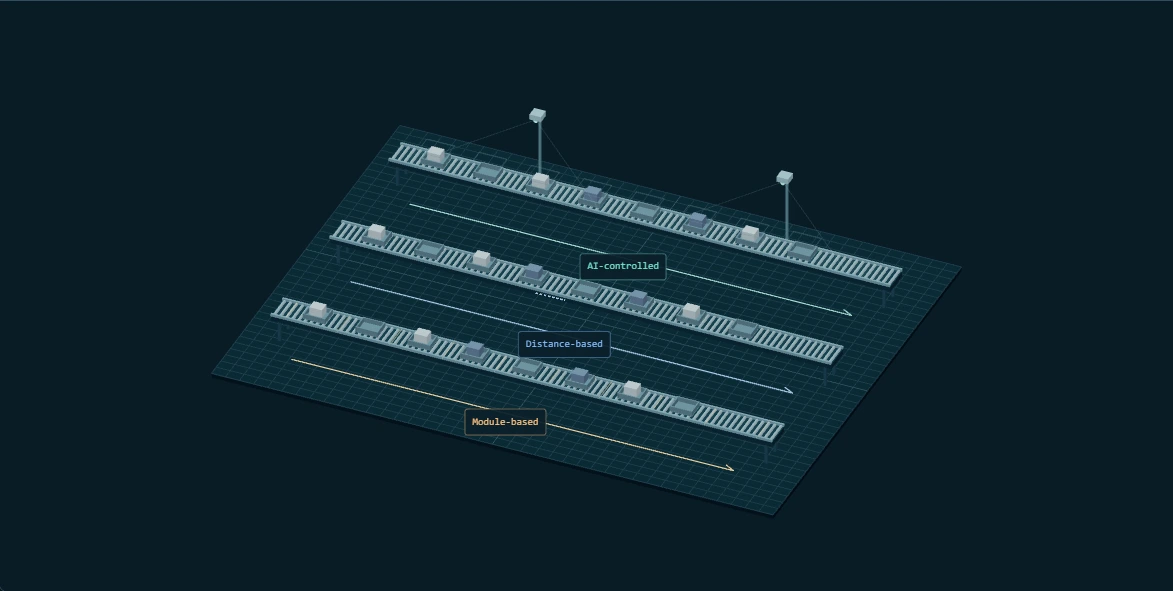
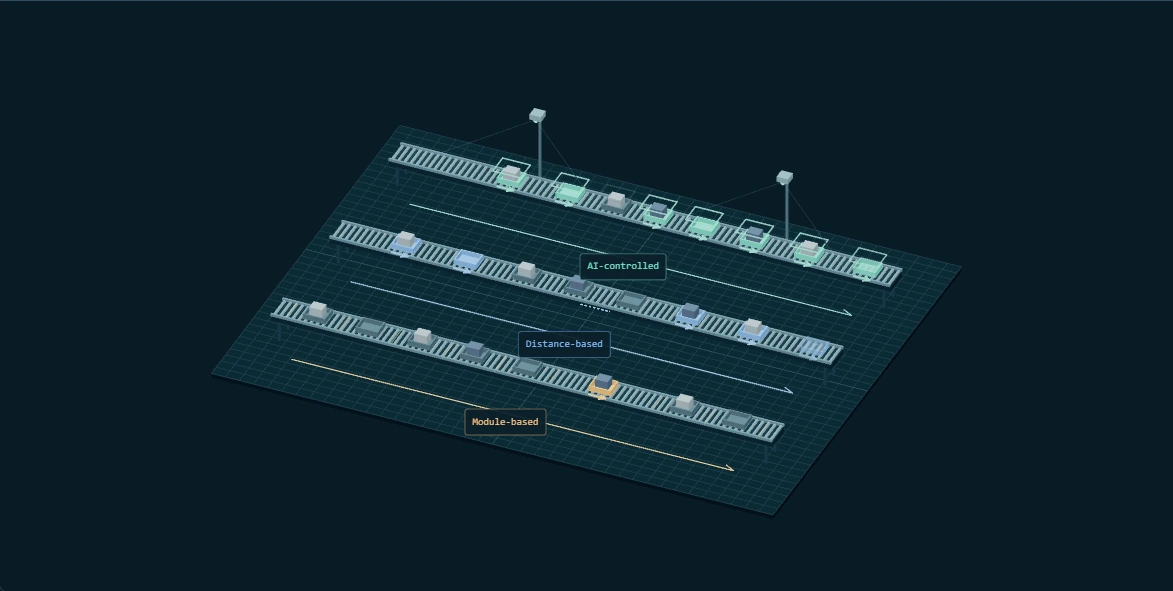
Computer vision applies machine learning to visual information about tray activity. Optimisation learned from millions of tray movements selects which trays should move next; connected lane controls hold, release and advance individual trays. Selected sensor and lane context may be combined through sensor fusion. Physical movement follows the configured lane controller and safety interlocks.
The illustration compares three longer reclaim conveyors with the same starting trays and maximum presentation speed. AI-controlled movement varies the advance of individual trays. Conventional movement waits until the module ahead is fully clear. The distance-based example uses a preset spacing rule. Tracking outlines and cameras represent computer vision on the AI-controlled lane.
A panel beside the animation compares model average throughput: approximately 1,370 trays per hour for AI-controlled movement, 1,250 for distance-based movement and 350 for conventional module-clearance movement. These rounded values are calculated from the comparison sequence.
Local camera checks and tray movement control
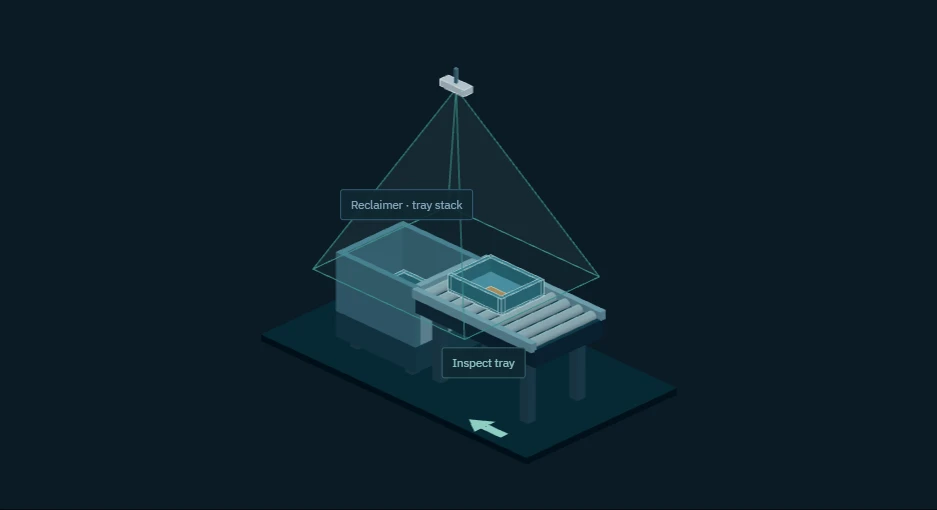
ETDM and THMM control tray movement through connected lane controls, holding and releasing trays according to verified checks.
View the product example · Permanent figure link
Empty-tray detection (ETDM) applies machine learning to visual information from a local camera to check a tray after collection. Where configured, sensor fusion associates the result with tray identity, occupancy and equipment state. ETDM holds tray movement when an item remains or the reclaimer is obstructed, and releases an empty tray into return after the checks pass.
Tray hygiene monitoring (THMM) applies machine learning to visual information to check loading before screening, with selected spatial and equipment observations associated through sensor fusion. The selectable issues are an overhanging item, excessive loading height, and an item on the rollers outside a tray. THMM holds the conveyor for correction and releases the corrected tray into screening after a successful recheck.
The interactive scene shows event-by-event states and corresponding reasons. Connected lane controls execute hold and release commands, subject to the lane controller and safety interlocks. The website simulation sends no physical control signals; only the empty-tray and loading-check modules are offered on the current lane page.

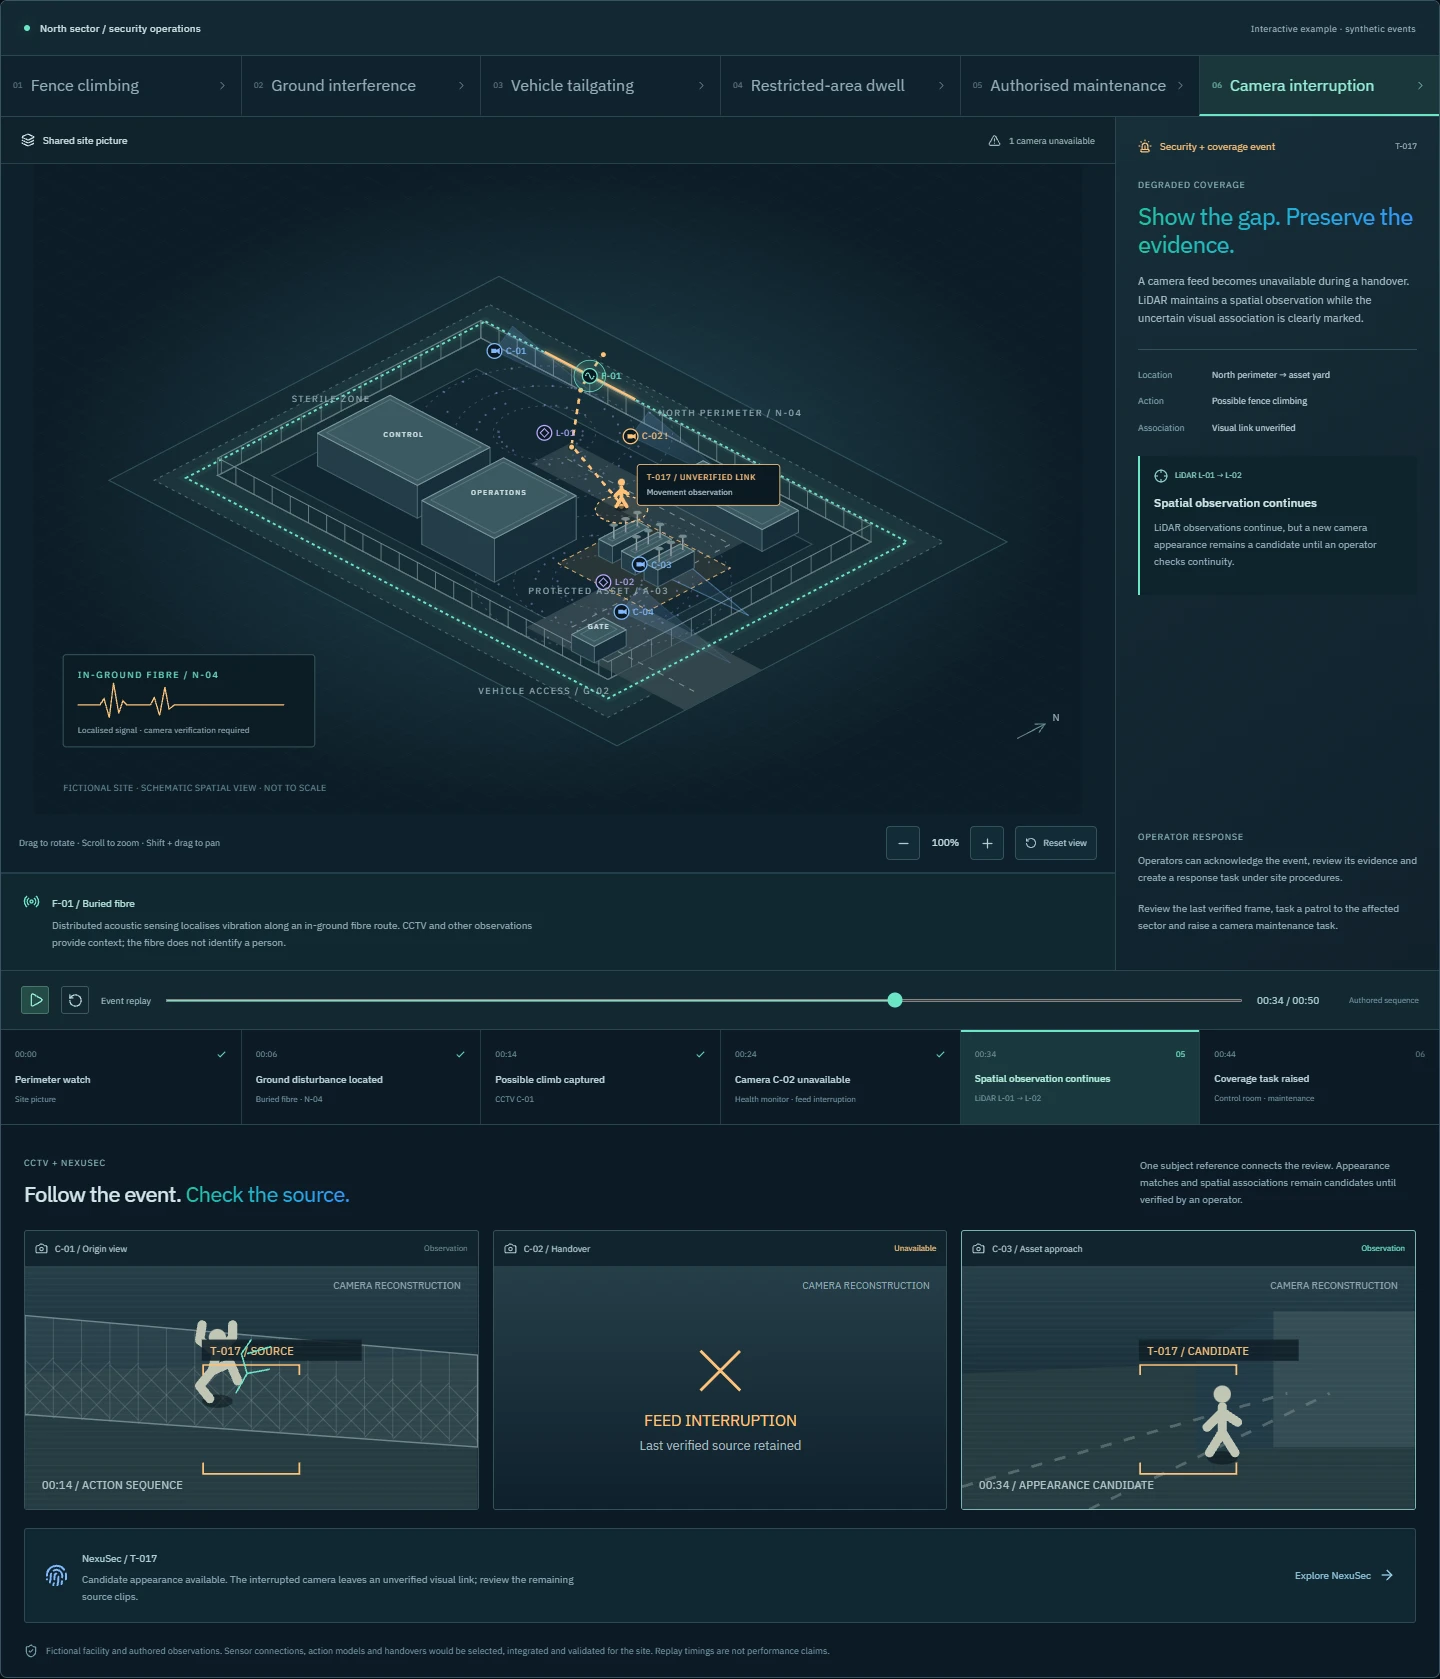
Perimeter detection, verification, tracking and response
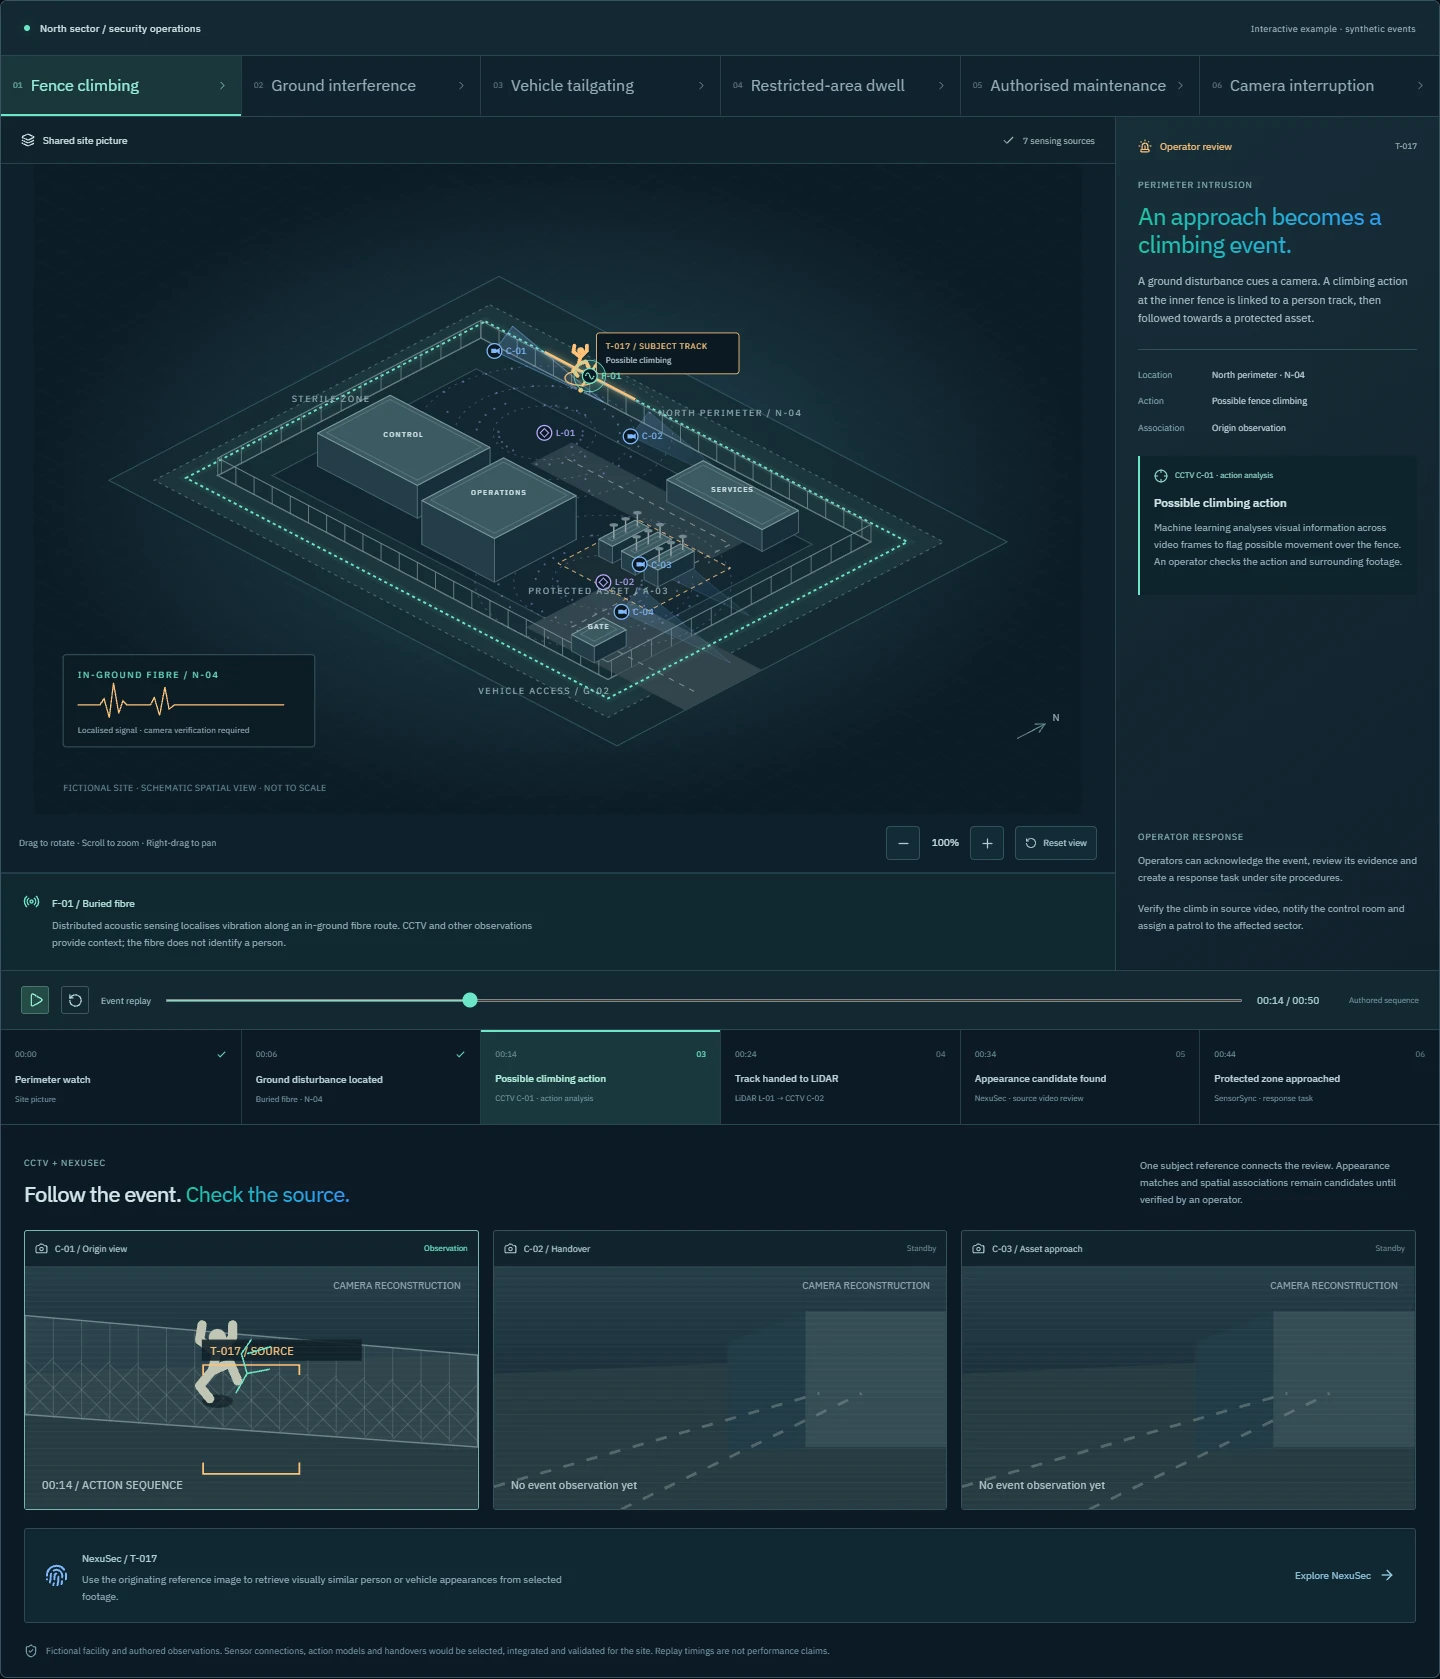
Six replay scenarios connect sensing, camera evidence, spatial movement and operator review.
View the product example · Permanent figure link
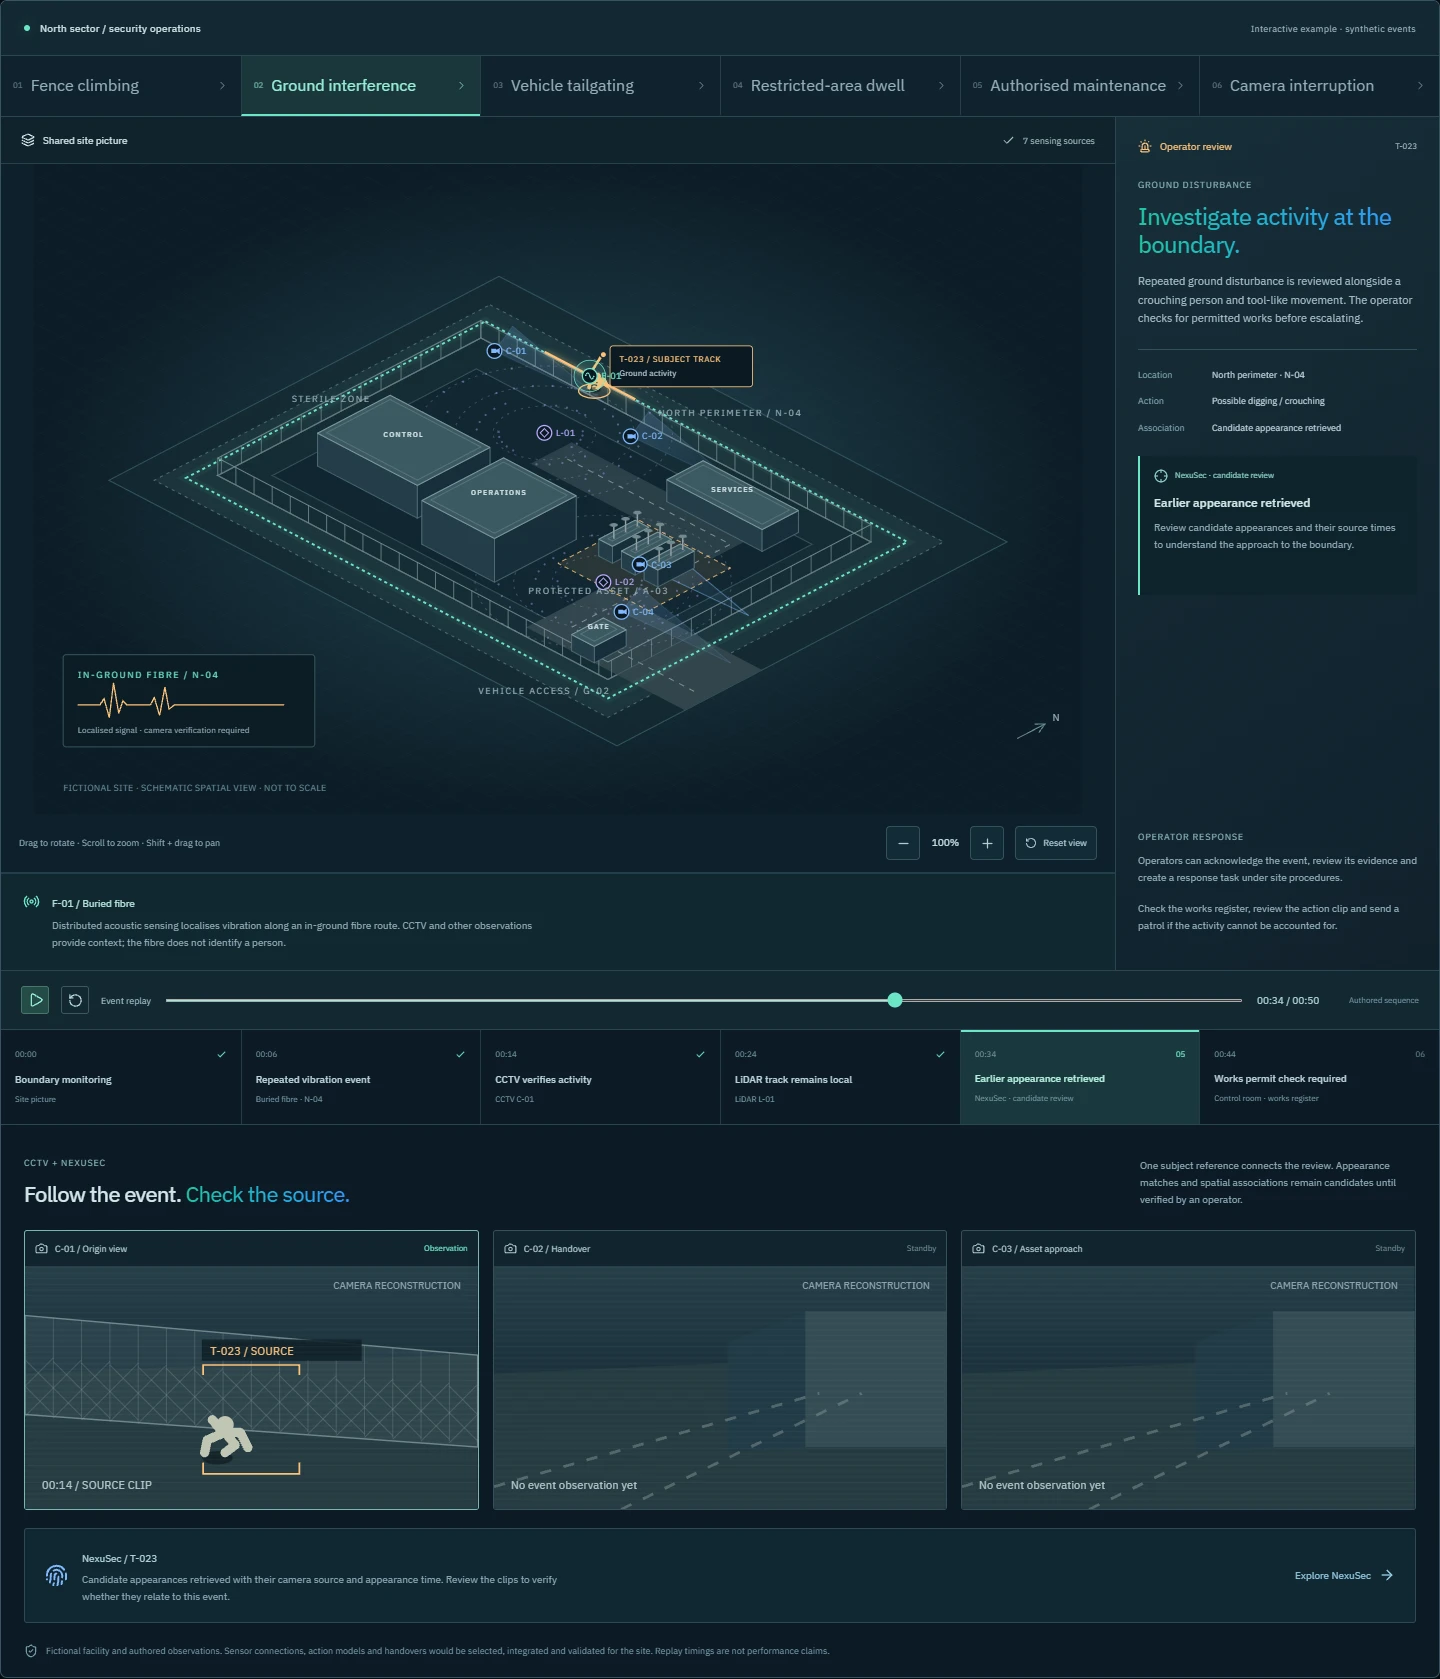
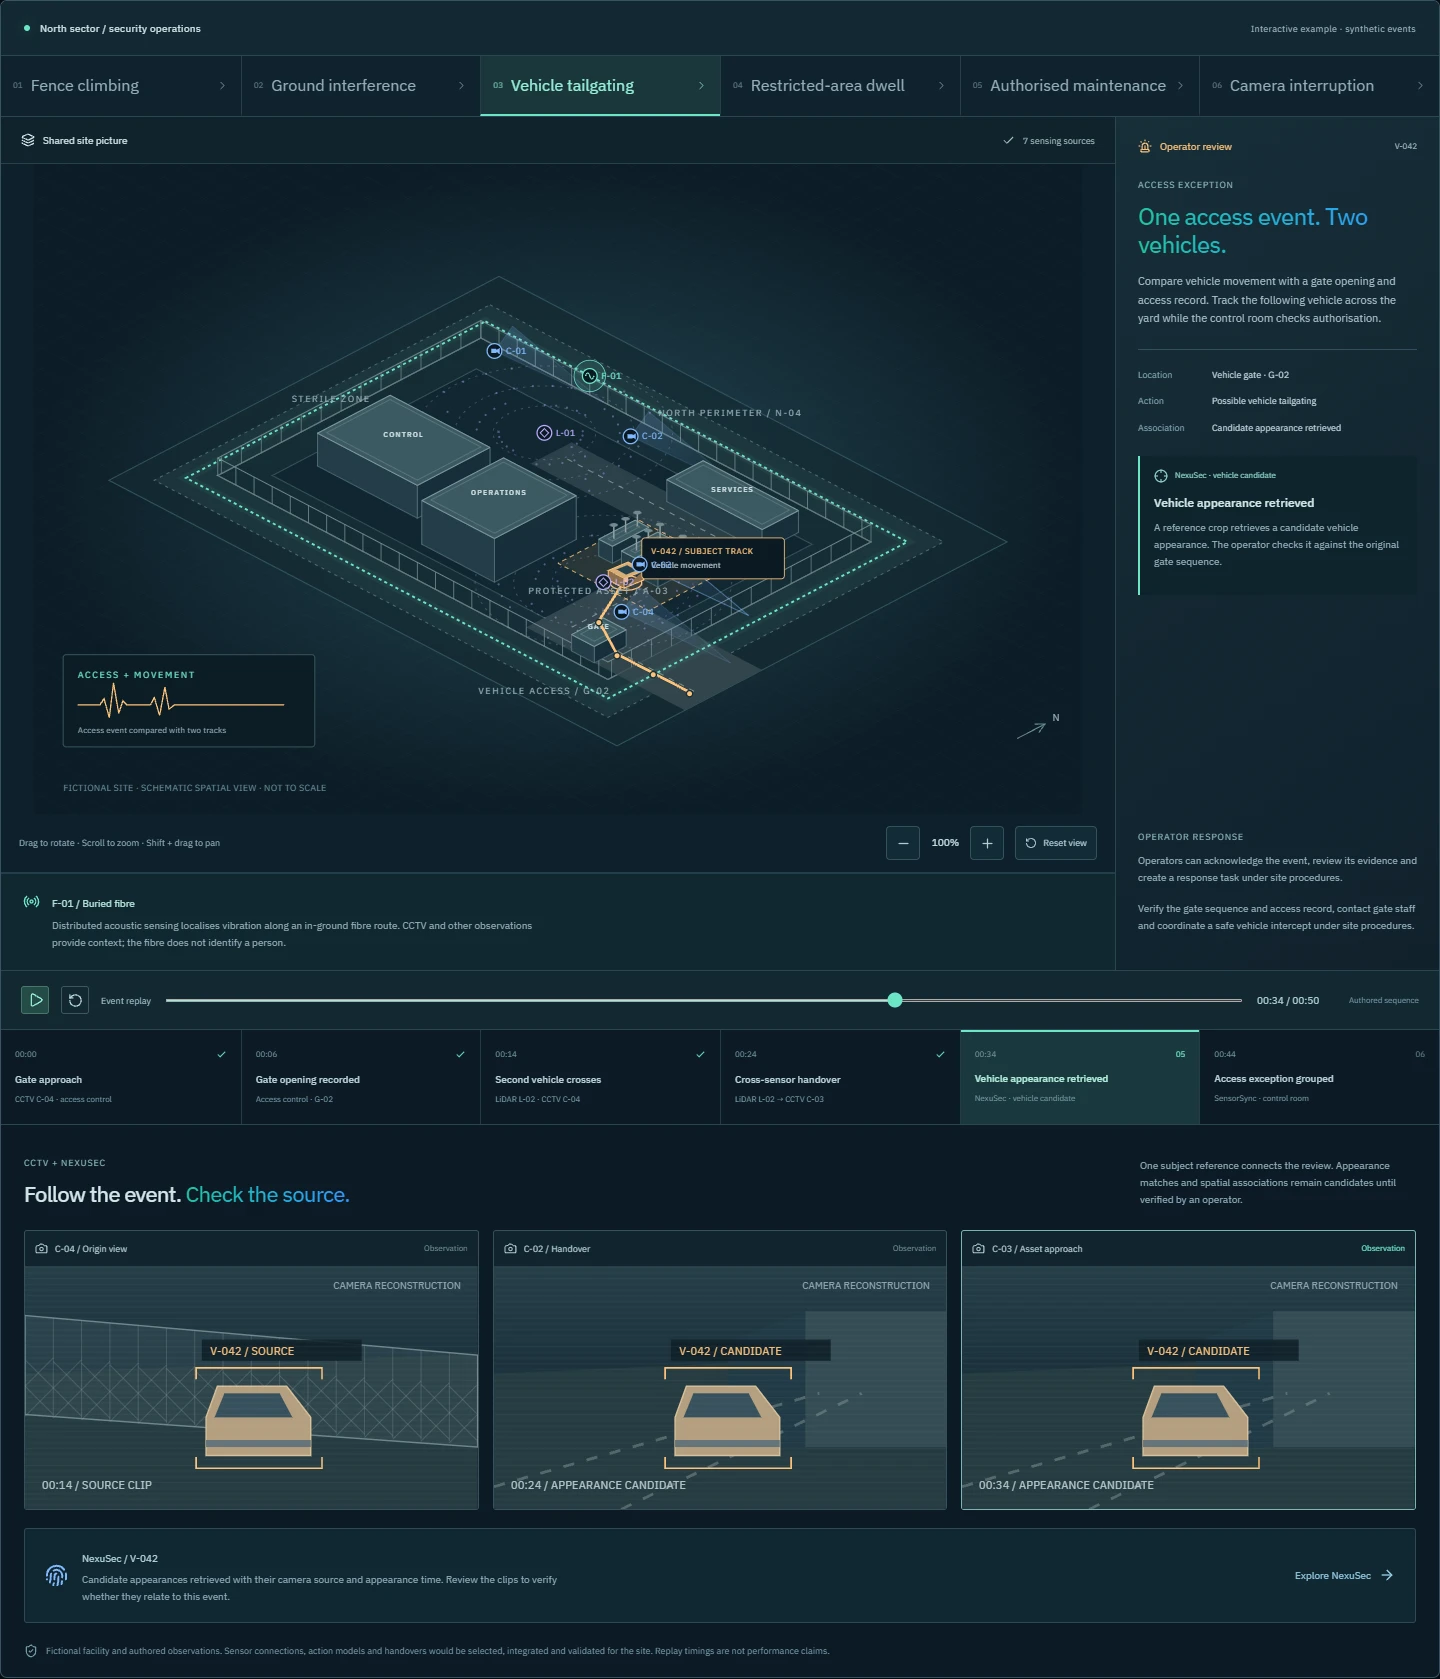
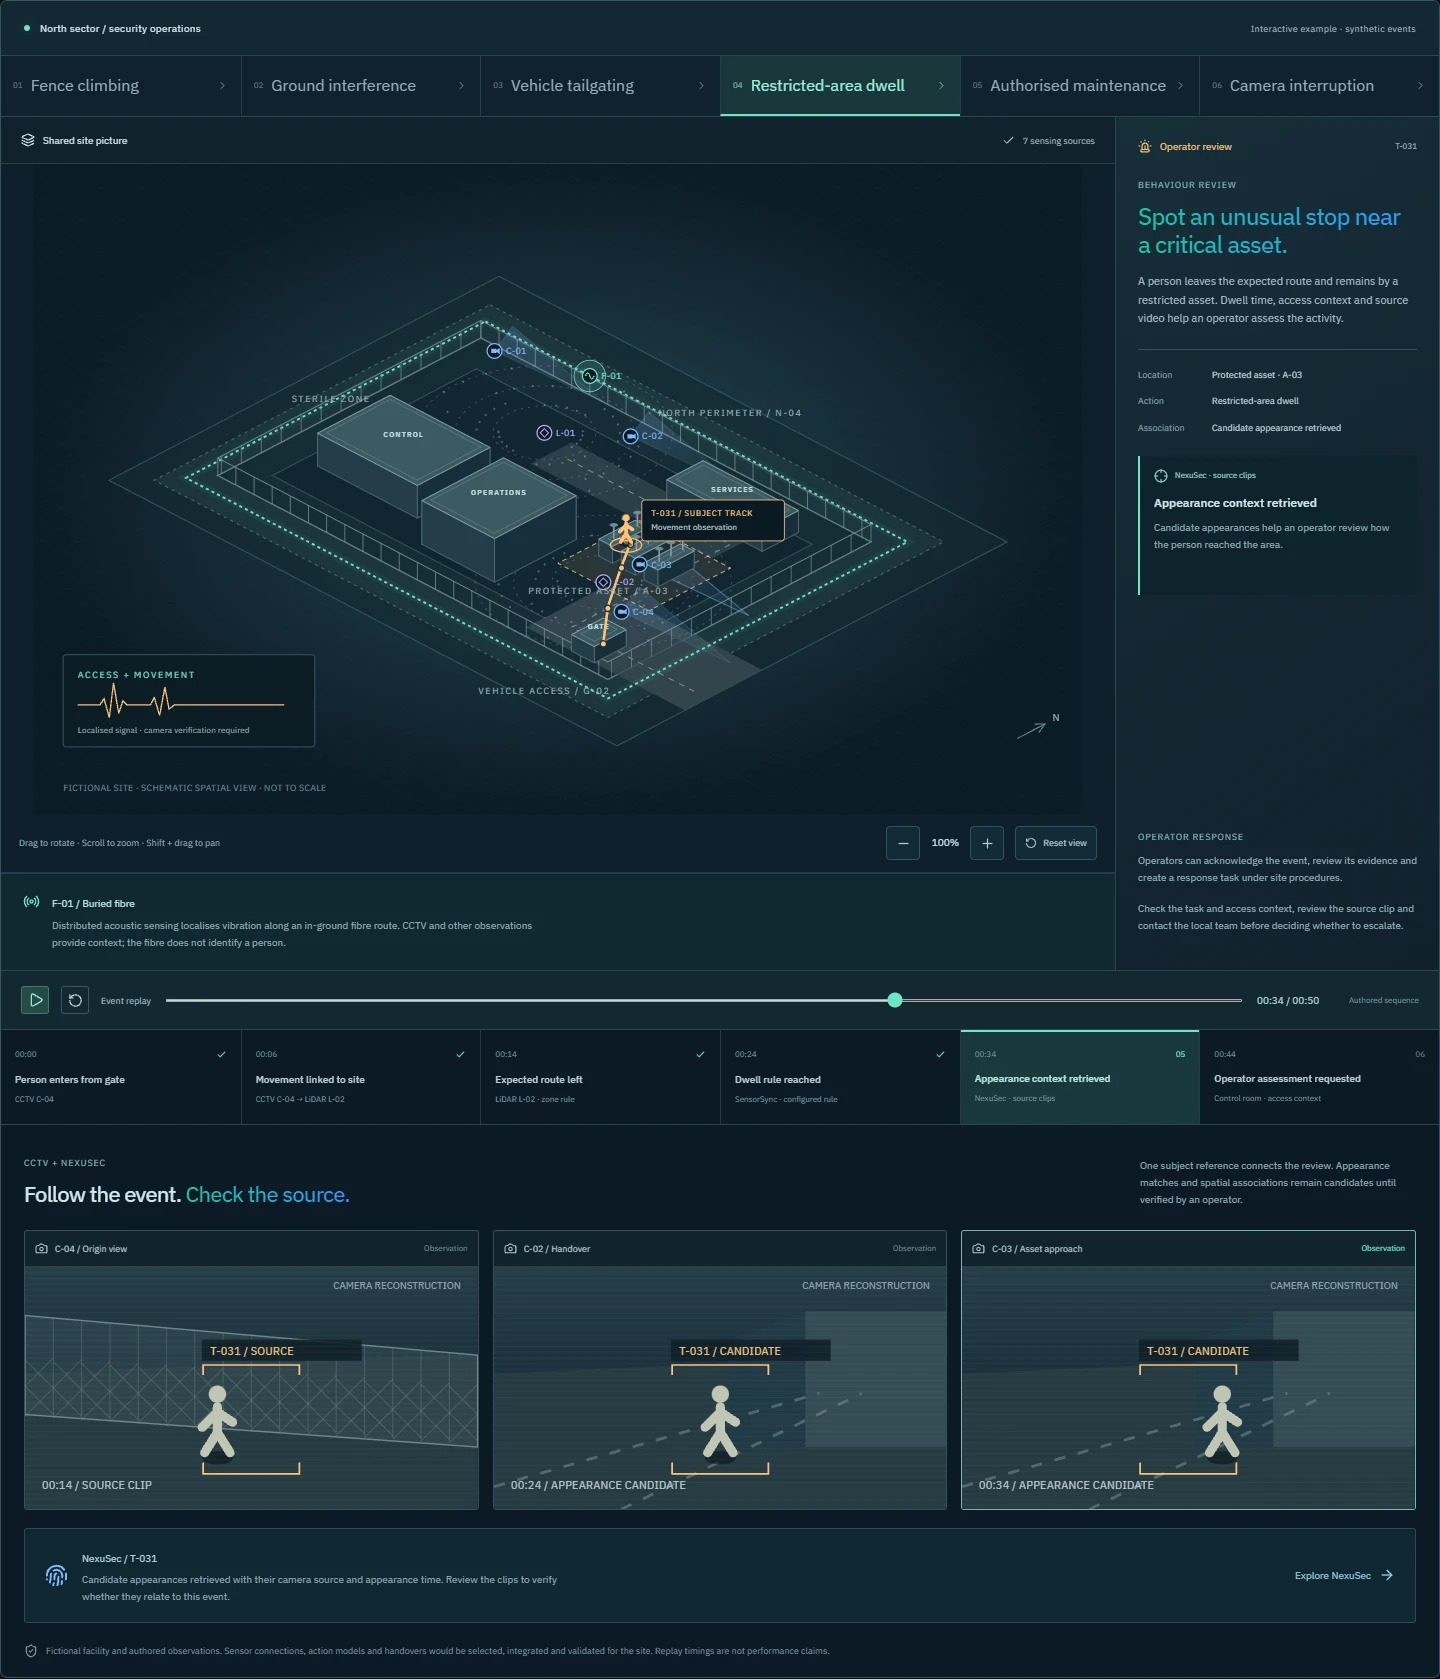
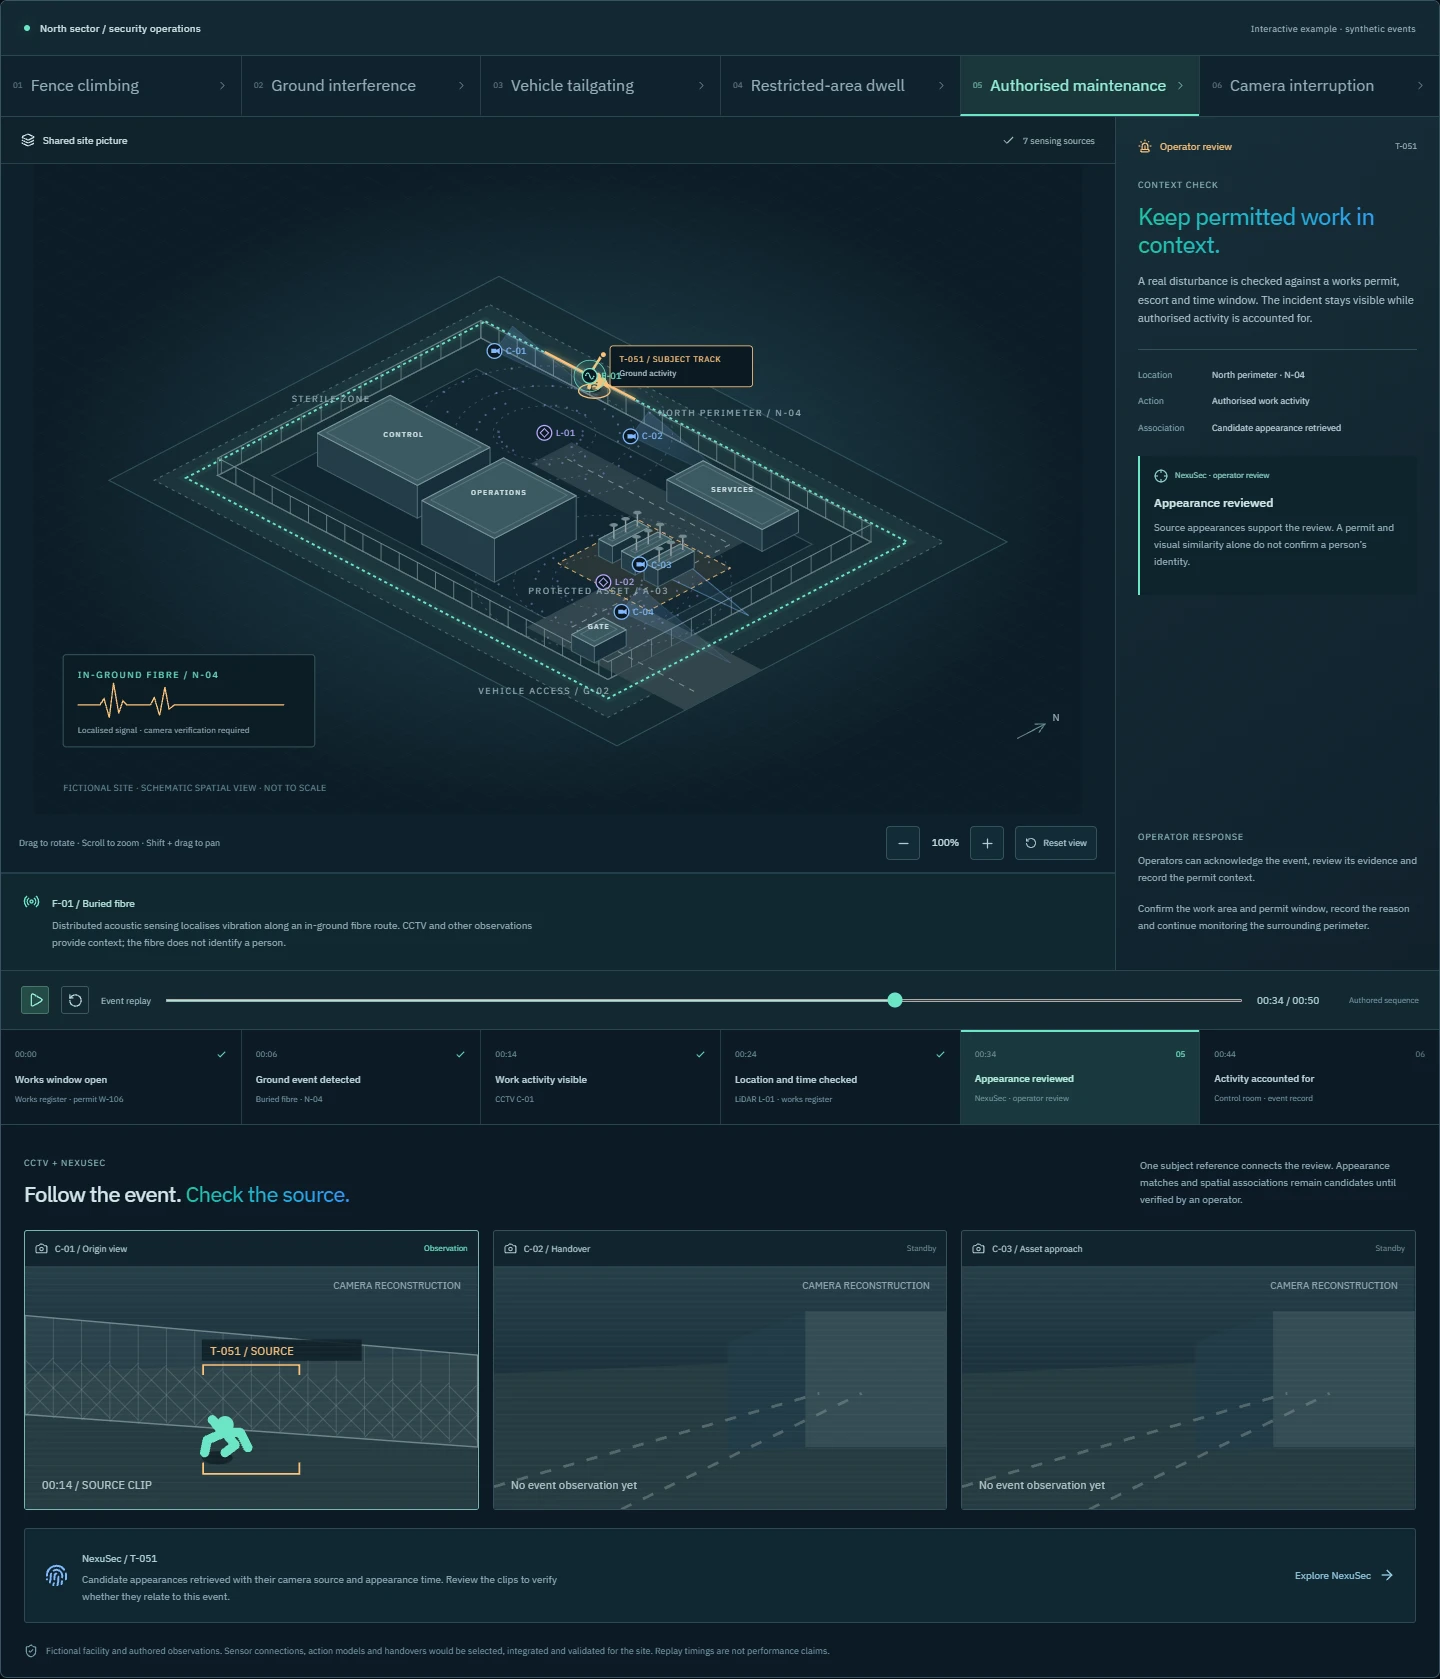
The fictional energy campus illustrates machine learning applied to CCTV images and video for people, vehicle, action and appearance analysis, with sensor fusion associating these outputs with buried fibre sensing, LiDAR and access context. An originating event supplies a time and zone. Its location cues a camera view; the sequence of observations supports review of the action and movement between protected areas.
Fence climbing shows an approach, disturbance, camera verification and onward tracking. Ground interference shows local disturbance and crouched activity. Vehicle tailgating relates a second vehicle to an authorised gate movement. Restricted-area dwell relates repeated presence and time in a zone. Authorised maintenance adds work-window and permission context. Camera interruption preserves the last verified observation and explicitly marks uncertainty after lost coverage.
The replay timeline changes the map, source-camera context, incident stage and evidence narrative together. Replay starts when the example comes into view and pauses off-screen, with manual pause, seek and replay controls retained. Reduced motion leaves it manually operated. Dragging rotates the spatial site view; mouse dragging vertically or using the arrow keys changes the viewing elevation. Zoom buttons, the mouse wheel and plus or minus keys change magnification from 75% to 250%. Wheel zoom follows the pointer location. Shift-drag or Shift-arrow keys pan the site; Home or Reset view restores the initial angle, scale and position. Buildings, sensor coverage, tracks and labels are projected together as the view changes, while incident and source records remain the same. The sensor overlays remain visible together. Candidate appearances can be investigated using a reference image or a separate description query in NexuSec. Explanatory text describes how operators can acknowledge events, record context and create response tasks under site procedures; the example has no acknowledgement or task-dispatch action. Operator verification and response remain distinct from detection.
All incidents, tracks, observations and replay times are authored examples. The screenshots preserve each selectable scenario; they are not footage from a customer installation or claims of detection accuracy.
Visual machine learning, sensor fusion and screening technologies
The following describes possible arrangements across the illustrated product families. The catalogue is broad and non-exhaustive. Sources may be used individually or in selected combinations; not every technology is integrated, demonstrated or appropriate to every product. Specialist and research techniques are identified separately from routine checkpoint equipment.
From visual information to an associated event
Acquire live or recorded visual information and selected sensor or screening outputs. Retain source identifiers, timestamps, calibration, coordinate frames, quality and available uncertainty. Processing may occur at the sensor, on an edge device, on premises, in the cloud or across these locations.
Apply trained visual models to suitable frames, image sequences, depth data, point clouds or scan volumes. Examples include object detection, instance or semantic segmentation, keypoint and pose estimation, multi-object tracking, optical flow, activity recognition, visual-language models, image or text embeddings, appearance retrieval, OCR and anomaly detection. Models and training data are selected for the modality and task; an ordinary camera does not inspect concealed contents.
Align sources in time and, where applicable, transform them into a shared spatial representation. Associate observations using time, position, motion, identifiers, appearance and task context. Fusion may combine raw measurements, extracted features, tracks, model scores, decisions or workflow events, using rules, statistical estimation, probabilistic or Bayesian methods, state estimation, learned multimodal models or combinations.
For a lane example, visual machine learning identifies a passenger loading a tray and records subsequent interactions. Spatial measurements help follow the passenger and tray; RFID or a visible code can supply a tray identifier. Screening equipment contributes scan, alarm and completion records. Association connects these to the relevant passenger, tray, article and required task, retaining links to source video and images for the interaction flipbook.
A configured workflow can request correction, a recheck or staff review, and can communicate permitted hold or release requests. Missing, conflicting, delayed or low-quality evidence remains unresolved rather than being treated as verified completion. A visual action or equipment passage alone does not establish a successful screening result. Permissions, recipient verification, equipment interfaces and approved site procedures govern any handover or control.
Visual information and optical sensing
- Visible-light colour or monochrome images; CCTV, fixed, PTZ, panoramic, fisheye, line-scan, area-scan and high-speed cameras; still images and recorded or live video.
- Low-light and near-infrared imaging; short-, mid- and long-wave infrared imaging; thermal imaging and thermography; ultraviolet imaging; polarisation imaging; multispectral and hyperspectral images.
- Stereo and multi-view imaging; RGB-D cameras; structured light; time-of-flight depth cameras; event cameras; 3D surface images, photogrammetry and laser profilometry.
- Visual text and codes, including OCR, number-plate recognition, barcodes, QR codes and other machine-readable fiducials; image-derived object, interaction, placement and appearance features.
Range, position and movement
- Scanning, solid-state or flash LiDAR; laser rangefinders; 2D or 3D point clouds and range images.
- Radar, including Doppler, FMCW, ultra-wideband and millimetre-wave radar; ultrasonic range, proximity and occupancy sensors; active infrared distance sensors and light curtains.
- Ultra-wideband positioning, Bluetooth/BLE beacons and angle measurements, Wi-Fi positioning or channel-state sensing, GNSS/GPS and other satellite positioning, inertial measurement units, accelerometers, gyroscopes, magnetometers, odometry and encoders.
- Selected passive RF receivers, spectrum monitoring, radio direction finding and RF localisation can provide transmitter or device observations; these observations require separate association with a person, vehicle or incident.
Identifiers, access and custody context
- Passive or active RFID, including LF, HF, UHF and NFC arrangements; tag readers, transponders and supported real-time location tags.
- Tray, baggage, parcel, article, passenger-session and vehicle identifiers; boarding-pass or credential readers; access-control transactions, gate state, authorised work windows and escort records.
- Where selected and permitted, biometric matching outputs such as face, fingerprint, iris or palm/vein verification. Appearance similarity and tracking are distinct from verified personal identity.
- Linked interaction, custody, routing, storage, collection, delivery and recipient-verification records, including records from external logistics systems.
Contact, load and equipment sensing
- Load cells, scales, pressure mats, instrumented floors and seating, force or torque sensors, capacitive or inductive proximity sensors, contact switches and magnetic door contacts.
- Photoelectric break beams, passive infrared motion sensors, microwave occupancy sensors, conveyor encoders, motor current, belt speed, vibration, gate position and equipment interlocks.
- PLC, SCADA and building-management signals; equipment APIs, alarms, health, maintenance, availability and processing-state records; connected screening and staff-confirmation records.
Acoustic, fibre and perimeter sensing
- Microphones and acoustic arrays; ultrasonic or other acoustic measurements; vibration sensors, accelerometers, geophones and seismic ground sensors.
- Distributed acoustic, vibration, strain or temperature sensing on optical fibre; fibre Bragg grating sensors; fence-mounted vibration or microphonic cables; taut-wire and contact-based barriers.
- Buried pressure, seismic, magnetic or radio-frequency disturbance sensors; leaky-coaxial cable, electric-field and capacitance sensors; microwave barriers; active infrared beams and laser barriers.
- Environmental context such as temperature, humidity, light, precipitation, wind, air quality, smoke, particulates and gas measurements, used where relevant to activity or source quality.
Screening by X-ray and volumetric imaging
- Single-view or multi-view transmission X-ray; single-, dual- or multi-energy imaging; backscatter imaging; computed tomography (CT), cone-beam CT and other supported volumetric reconstructions.
- Spectral or photon-counting X-ray imaging; X-ray diffraction and coherent-scatter material analysis in specialist configurations; radiographic and CT inspection of baggage, parcels, cargo, vehicles, devices or components.
- Explosive detection systems (EDS), explosive detection systems for cabin baggage (EDSCB) and automated prohibited items detection systems (APIDS): equipment or software categories whose outputs may include images, detections, alarms, review decisions and task status.
- Machine learning on suitable X-ray images or CT volumes can locate and segment objects, classify supported categories, compare expected structure and flag candidates for review. Scan viewing, annotation and synthetic object insertion can also support model training and evaluation.
People, metal and concealed-item screening
- Walk-through, handheld and other metal detection equipment; electromagnetic induction and magnetometer-based detection; shoe metal detection and shoe screening arrangements.
- Active or passive millimetre-wave imaging and other selected body or concealed-item scanners; automatic anomaly or prohibited-item detection software; specialist terahertz imaging or spectroscopy where technically suitable.
- Ionising-radiation body imaging is a separate specialised modality, usable only where specifically authorised and appropriate. Listing it here does not propose adding it to an ordinary camera or AIVA portal.
Trace, vapour, liquid and chemical screening
- Explosive trace detection (ETD), including collected particles or swabs; explosive vapour detection (EVD); liquid explosive detection systems (LEDS), bottle and container screening; shoe explosive detection.
- Ion mobility spectrometry, differential mobility spectrometry, mass spectrometry and gas chromatography with suitable detectors, including GC/MS; chemical sensor arrays and electronic noses.
- Liquid or container analysis using selected optical, Raman, infrared, microwave, radio-frequency, dielectric, ultrasonic or magnetic-resonance methods, depending on equipment design and sample compatibility.
- Raman, surface-enhanced Raman and spatially offset Raman spectroscopy; infrared and Fourier-transform infrared (FTIR) spectroscopy; laser absorption, fluorescence, chemiluminescence, colorimetric and electrochemical sensing where appropriate to the substance and sample.
- Specialist or research arrangements can include terahertz spectroscopy, photoacoustic or photothermal analysis, nuclear quadrupole resonance and neutron-based material analysis. These require purpose-built equipment and task-specific validation.
Radiological and nuclear-material screening
- Passive gamma-ray and neutron detection; radiation portal monitors, personal radiation detectors, handheld survey instruments and radiation isotope identification devices.
- Scintillation or semiconductor spectroscopy and other appropriate detector technologies; source, energy-spectrum, alarm, location and review records supplied by the screening instrument.
Other specialist screening and detection inputs
- Chemical and biological monitoring can supply gas, vapour, aerosol or particle measurements, fluorescence or optical-scattering signals, immunoassay results, molecular-assay results or other instrument records. Sampling, laboratory confirmation and handling requirements depend on the target and method.
- Cargo or vehicle occupancy checks can contribute carbon-dioxide measurements, acoustic or vibration observations, heartbeat or motion sensing, thermal imagery and inspection results. These are candidate observations rather than automatic confirmation that a person is present.
- Document examination can contribute visible, ultraviolet or infrared images, optical security-feature checks, chip or credential validation and staff findings; these records can be associated with a session under the selected procedures.
Device, component and material inspection
- Visual or optical inspection, microscopy, borescopes, 3D surface measurement, industrial X-ray or gamma radiography, industrial CT and specialist neutron imaging.
- Ultrasonic testing, phased-array or time-of-flight ultrasonic techniques, acoustic emission, eddy-current and other electromagnetic testing, magnetic-particle inspection and liquid-penetrant testing.
- Thermography, shearography, strain or vibration analysis, electrical continuity, resistance, capacitance or impedance measurements and functional device tests, where appropriate to the inspection.
- Reference-image or reference-volume comparison, component recognition, missing or additional part detection, configuration comparison and anomaly analysis. These industrial inspection methods are distinct from routine passenger screening.
Operational records and human screening
- Search, pat-down, secondary inspection, canine screening, document examination, alarm resolution and staff-confirmed completion records. These contribute workflow evidence without being relabelled as electronic sensors.
- Queue, staffing, flight or transport schedules, resource availability, accessibility requirements, passenger instructions, authorised permissions and incident records can provide context for fusion, validation, forecasting and response.
- Any selected combination may use instrument-native analysis, separate machine-learning models, human review or a combination. Availability, compatibility and required approvals are determined for the actual equipment and installation.
Background references
These public references explain selected technology families. They do not certify NWPRO products or establish that any listed integration has been implemented.
- NIST: sensing and perception. Camera calibration and 3D sensing.
- NIST: quantitative information from images. Spatial, spectral, temporal and polarisation information.
- NIST: audiovisual sensor fusion. An example of combining information from different modalities.
- NPSA: perimeter intrusion detection. Perimeter sensor families and site context.
- ECAC: security equipment categories. Screening equipment categories; evaluation applies to specific configurations.
- DHS: baggage, cargo and people screening. Screening research and development.
- DHS: explosives trace detectors. Trace detection and ion mobility spectrometry.
- DHS: chemical analysis technologies. IMS, Raman and FTIR analysis.
- DHS: portable GC/MS. Field chemical analysis.
- NIST: microwave liquid analysis. An example of non-optical liquid identification.
- NIST: biological detection equipment. Biological detection and identification methods.
- GAO: air-cargo screening methods. Historical discussion of cargo screening and occupancy checks, not a current equipment approval list.
- IAEA: industrial non-destructive testing. Optical, radiographic, ultrasonic, electromagnetic and other NDT methods.
- PNNL: infrared and terahertz research. Specialist spectroscopic measurements.
- Nuclear quadrupole resonance research. An experimental material-detection approach.
- DHS: radiological detection instruments. Portal monitors, isotope identification and personal detectors.